How to ensure higher-density housing developments still have enough space for residents’ recreation needs

By Anthony Veal Adjunct Professor, Business School, University of Technology Sydney and Awais Piracha Associate Professor of Urban Planning, Director Academic Programs, Geography Tourism and Urban Planning, Western Sydney University

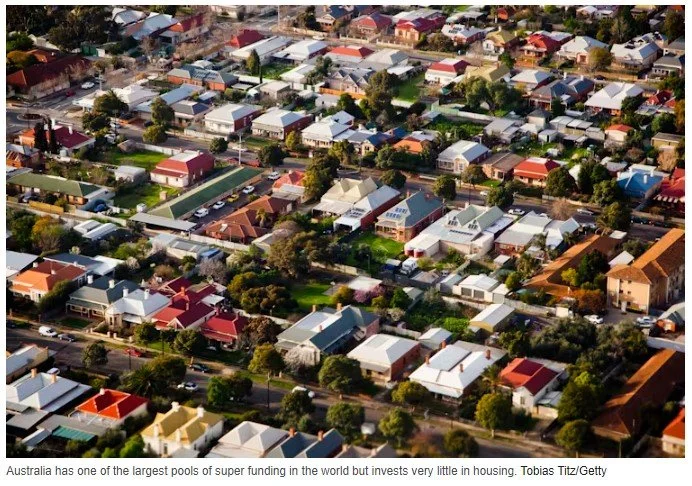
Growing populations and housing shortages are affecting cities worldwide, including in Australia. It’s driving them to adopt high-density development near public transport hubs instead of endless suburban sprawl on city fringes.

In Sydney, the state government has plans for transport-oriented developments within 400 metres of 37 existing train stations. These will include 170,000 new dwellings.

In Melbourne, work has begun on a massive project, the Suburban Rail Loop. In the first of four stages (SRL East), 70,000 dwellings will be built around six new stations.

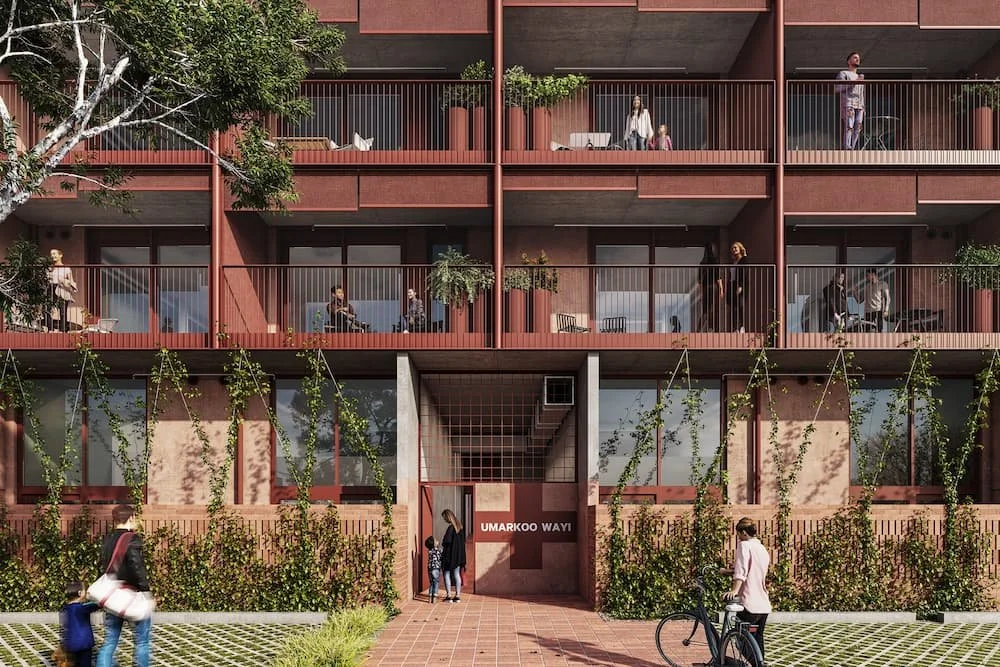
These developments pose unique challenges for urban planners. In particular, residents of these higher-density precincts will still need public open space and recreation facilities.

Communities and local councils are concerned higher residential densities will increase pressures on infrastructure, services and open space. Local residents often oppose such developments. They fear these new, denser communities may lack vital infrastructure and services, shifting the burden of meeting these needs onto neighbouring areas.

Open spaces are crucial for physical activity and an attractive and healthy urban environment. However, traditional methods of planning open space are designed for lower-density suburbs. They struggle to meet residents’ recreational needs in high-density areas.

We’ve developed a new planning tool to help ensure higher-density developments provide enough recreational space.

High density challenges traditional planning

We reviewed open space and recreation planning methods around the world and assessed their suitability for meeting recreational needs in high-density areas.

The most common “standards” method specifies a certain area of open space, such as hectares per 1,000 population. Our review found it has been criticised for its “one size fits all” approach and lack of supporting research evidence. The approach may work in low-density suburbs but not in high-density areas that simply don’t have enough open space to meet the specified standard.

Another traditional approach is the “demand-based” model. It relies on consultation with an existing population.

But the population of the transport-oriented development is not resident at the time of planning. It’s also likely to differ from the surrounding population – for example, in age structure.

A better approach is needed. Our solution is the Recreational Activity Benchmark (RAB) model.

This model focuses on the new population’s likely level of recreation participation. This benchmark is based on anticipated characteristics of the new residents, such as age structure, and associated recreation patterns. Existing survey data from across the metropolitan area indicate the patterns we can expect.

A mix of strategies is needed

To meet this benchmark level of recreation demand in the limited space available requires a mix of strategies.

The first strategy is to rely more on indoor facilities such as sports halls, gyms and swimming pools. These allow for high levels of physical activity using much less land than traditional playing fields. They can be open for longer hours, are unaffected by weather and can be built as part of high-density, multi-purpose developments.

The second strategy is repurposing non-traditional open spaces for recreation. In particular, designing streets, footpaths and pavements as pleasant green areas encourages walking and cycling. Maintaining these areas for such activities thus also provides for recreation.

As part of this strategy, rooftops, school yards and other unconventional areas can be transformed into active recreation zones. Cities around the world have used innovative design solutions.

Singapore’s Dual-Use Scheme opens school yards to the public after hours. Seoul has creatively transformed a former highway overpass into an attractive walkway and public space.

A highway overpass was turned into the Seoul Skygarden running through the congested heart of the city. Sagase48/Shutterstock

Other solutions include green streets, vertical gardens, multi-functional street furniture and water features.

Specific examples include Tokyo’s “green roads” and Seoul’s street workout stations. The Singapore Sports Hub employs a dedicated team to offer diverse activities, making the best use of limited space.

These solutions all help meet physical recreation needs in high-density developments. The limited amount of open space can then be reserved for informal recreation, such as walking and quiet contemplation.

In Japan, green roads integrate greenery along the road with surrounding green spaces. photoK-jp/Shutterstock

Making sure recreation needs will be met

Higher-density development around transport hubs aims to overcome housing shortages and avoid the harmful impacts of urban sprawl. Our planning tool can help overcome community concerns about these developments lacking spaces for recreation.

This tool establishes a benchmark recreational activity level derived from participation rates per person across the metropolitan area. It calculates the land needed to support recreation and reallocates participation to activities that require less land or can be done indoors. In this way, it ensures high-density areas can still meet residents’ recreational needs.

The RAB model enables planners to produce a range of possible scenarios. Different mixes of facilities and activities can be flexibly developed to suit different local environments and different anticipated resident populations.

This article was originally published on The Conversation. Read it here.

Grattan on Friday: it’s good to put administrators into the CFMEU – but how do you prevent future crops of bad apples?

By Michelle Grattan Professorial Fellow, University of Canberra

John Setka leading a CFMEU rally in Sydney in 2023.CREDIT:MICHAEL QUELCH

Former leading Canberra press gallery journalist, Laurie Oakes, now retired, had a cut-through question about the government’s response this week to the CFMEU crisis.

“Bill Shorten tough and effective on CFMEU,” Oakes posted on social media after Shorten’s appearance on the ABC’s 7.30. “Why wasn’t it Albo taking the lead?”

The prime minister could point out he was in Queensland, campaigning, and unveiling candidates for the election. Regardless, Oakes’ question was spot on.

The PM wouldn’t have missed the sharp comparison with Shorten, the former Labor leader, who is always closely watched by the Albanese camp.

Albanese has answered questions about the CFMEU scandal all week. But despite the magnitude of the issue, he has left the public front-running to Workplace Relations Minister Tony Burke.

The government needed to cauterise the imbroglio as fast as possible. Hence the huge flurry of activity, centred on having the Fair Work Commission get underway the appointment of administrators into the construction division in eastern Australia.

On Thursday the ALP’s national executive suspended the affiliation of the construction division to the NSW, Victorian, South Australian and Tasmanian branches of the Labor Party. This means the party won’t levy any affiliation fees or accept donations. Delegates won’t be able to attend ALP conferences.

(The construction division is almost all that is left of the union. The miners have left and the manufacturing division is on the way out. The only other division is the Maritime Union of Australia and no action has been taken against it.)

The desire to put the CFMEU issue behind it may have driven the government’s choice to have the Fair Work Commission apply to appoint the administrators, rather than doing so itself.

“What I’m wanting to do is make sure this is a process under the regulator and not a political process,” Burke said at his Wednesday news conference.

Burke has promised the government will play an active supportive role to the Fair Work Commission, even legislating if that becomes necessary. Still, it’s hard to avoid the conclusion the government’s aim is to keep the follow-through at a distance, especially in the run-up to the election. That’s likely to mean fewer media questions.

When he was workplace relations minister in the Gillard government, Shorten took a different course with the Health Services Union.

The HSU was even more scandal-ridden than the construction division of the CFMEU. In dealing with it, the government acted directly, itself applying to put in an administrator.

Shorten has a special interest in the CFMEU. The Australian Workers’ Union, which he formerly headed, has had years of conflict and competition with the CFMEU. Shorten retains his interest in industrial relations more broadly. Nevertheless it was notable to see him turn up in the high-profile 7.30 interview on the day of Burke’s announcement (albeit with approval from the PM’s Office).

Former leaders are always in a somewhat ambiguous position, given the levels of paranoia that characterise political parties. Shorten mostly stays within his ministerial guardrails, but inside those he determines his own tactics.

At the moment, as Minister for the National Disability Insurance Scheme, he is pulling out all stops to try to get his legislation to reform the scheme through parliament. Recently this included holding a news conference with Pauline Hanson.

Shorten won’t have another chance at leadership, but he has a legacy to protect and advance. The NDIS grew out of his idea. It’s important to the government generally that the reforms are put on track before the election. It’s actually also in the Liberals’ long-term interests – it would be harder for a future Coalition government to rein in this scheme, which has run out of control.

Returning to the CFMEU, the week-long revelations have meant Labor has again found its post-July 1 “good news” on the cost of living totally overshadowed by domestic stories that are negative for it (never mind the drama in the United States). The first distraction, as the tax cuts were landing, was the resignation of Labor senator Fatima Payman from the party and speculation about whether a “Muslim vote” could harm Labor in western Sydney. Then came the union stories.

Labor will hope its quick response on the CFMEU issue will mean that in voterland it washes over fairly quickly.

Many people, one would expect, will be highly cynical about the reaction of political and union leaders who declare the revelations about criminality have come as “a shock”. While the extent and details may have surprised and appalled, the atrocious conduct of the construction union has been common knowledge.

The public would likely think the politicians protest too much. People’s general scepticism about their representatives was again highlighted by this week’s Essential poll that found three quarters of Australians think politicians enter into politics to serve their own interests.

It will take years to know whether industrial conduct in the construction industry can really be reformed. The deregistration of the Builders Labourers Federation in the 1980s failed to do the job.

The CFMEU’s Queensland/Northern Territory secretary, Michael Ravbar, a one-time member of the ALP national executive, flagged in a defiant statement that change will be fought by some. “Albanese has panicked and soiled himself over some unproven allegations in the media,” he said. “These gutless Labor politicians talk tough about affiliation fees and donations because that’s the only language they understand – money. The CFMEU is an industrial union, not a political outfit. Our strength has always come from our members on the shop floor, not from ladder-climbing politicians in the halls of power.”

After the ACTU suspended the construction division on Wednesday, ACTU staff were told to work from home as “a health and safety” measure. The CFMEU generates a level of fear in all sorts of places.

No doubt the administrators will clean out the union. But you’d be an optimist to feel confident that one collection of bad applies won’t eventually be replaced by another. Finding a way to stop the tree being blighted by yet more rotten fruit may be beyond any administrator. At the very least, it will require more rigorous regular spraying and pruning than we’ve seen in the past.

This article was originally published on The Conversation. Read it here.

Looking back at the Olympic venues since 1896 – are they still in use?

By Vaughan Cruickshank, Senior Lecturer in Health and Physical Education, University of Tasmania and Tom Hartley, Lecturer in Health and Physical Education Education, University of Tasmania

Olympic Games are big affairs that require massive infrastructure projects to build the various stadiums and venues.

Many of the sports have specific requirements – fake whitewater and rocks for kayaking, huge slopes for ski jumps, or sand for beach volleyball. On top of that, these venues need to be able to support large crowds and the technology needed to manage the events.

As former Victorian premier Dan Andrews discovered in 2023, hosting big sporting events costs big money.

The Tokyo Olympics are estimated to have cost A$23 billion dollars, a lot of which was spent building infrastructure.

A 2022 report from the International Olympic Committee revealed that 85% of the stadiums, venues and structures used in the Olympics are currently still in use.

But how are they used, were they new structures and what happened to the 15% of venues that have fallen into disuse?

Stadiums

Panathenaic Stadium in 1896 - Athens, Greece. Built and modified since circa 330 BC, it was used in the first modern Olympics in 1896. Via Wikimedia Commons

Panathenaic Stadium in 2021 - Athens, Greece. Currently used for various purposes. George E. Koronaios, via Wikimedia

The all-marble Panathenaic Stadium hosted the first modern Olympics in Athens, Greece in 1896. It was used again during the 2004 Olympics (archery and the marathon finish) and is now a popular tourist attraction that has hosted events such as concerts and fashion shows in recent years.

Francis Olympic Field in St Louis in the United States was used as the main venue for the 1904 Summer Olympics. It is the oldest Olympic stadium still in regular use for official sporting events.

It has been renovated several times and is currently used by Washington University’s track and field, cross country, football, and soccer teams.

Many Olympic stadiums continue to be used for local, national and international sports such as athletics and soccer, as well as large concerts and performances.

For example, the 1960 Summer Olympic Stadium in Rome, Italy is the home ground of the national rugby union team and soccer clubs Roma and Lazio. It has also hosted matches in the 1990 FIFA Soccer World Cup, UEFA Soccer Champions League, World Athletics Championships and more.

Fisht Stadium in Sochi, Russia hosted the 2014 Winter Olympics and Paralympics. It also hosted games in the 2018 Soccer World Cup (including Australia vs Peru) and is now the home stadium for soccer team PFC Sochi.

Cities that have hosted multiple Olympics have refurbished and reused venues.

For example Tokyo reused 1964 venues such as the Tokyo Metropolitan Gymnasium and Nippon Budokan Hall in 2021; the Los Angeles Memorial Coliseum and Rose Bowl were both Summer Olympic sites in 1932 and 1984 and will be used again in 2028.

Venues

The National Aquatics Centre, known as the 'Water Cube', under construction in 2007 – Beijing, China. Used in the 2008 Summer Olympics. Angus, via Wikimedia Commons

The National Aquatics Centre, known as the 'Water Cube', 2015 – Beijing, China. Used in the 2008 Summer Olympics.

Olympic venues continue to be used for sporting and non-sporting activities.

Many existing venues such as skiing slopes and summer venues such as Banyoles Lake (rowing - 1992 Barcelona Summer Olympics) and Wimbledon (tennis – 1908 and 2012 London Summer Olympics) hosted their sport before the Olympics and have continued to host it after the Olympics.

Other venues have been reused in a variety of ways.

For example, the stadium and skating and ice hockey venues used in the 1928 and 1948 Winter Olympics in St Moritz, Italy are now part of a private residence.

The 1980 Winter Olympic village in Lake Placid, US, is now a federal prison.

The Water Cube (swimming, diving, water polo – 2008 Beijing Summer Olympics) is now a popular water park.

Unused Venues

Alonzo Herndon Stadium, 2014 - Atlanta, Georgia. Used in the 1996 Summer Olympics. Peter Ciro

Copacabana Stadium, 2016 – Rio de Janeiro, Brazil. Used in the 2016 Summer Olympics. Currently dismantled. Gabriel Heusi via Wikimedia Commons

Some Olympic venues such as the Mt Eniwa downhill events site (alpine skiing – 1972 Sapporo Winter Olympics) and Copacabana beach volleyball arena (beach volleyball – 2016 Rio Summer Olympics) were temporary venues that were dismantled after the games as planned.

Many other older venues have been renovated and redeveloped.

Other venues have unfortunately fallen into disrepair for various reasons.

The Trebevic Olympic Bobsleigh and Luge Track (bobsleigh, luge – 1984 Sarajevo Winter Olympics) was damaged during the Bosnian War (1992-1995) and has not been repaired. It is now overgrown and covered with graffiti.

Alonzo Herndon Stadium (hockey – 1996 Atlanta Summer Olympics) is in a similar graffiti-covered state of disrepair.

Most of the Helliniko Olympic Complex (softball, canoe/kayak, hockey, baseball, basketball – 2004 Athens Summer Olympics) is closed or has been demolished due to poor planning and political, economic and administrative upheaval.

Australia

Melbourne Cricket Ground, 1956 – Melbourne, Australia. Used in the 1956 Summer Olympics. Radford, Anthony J., State Library of Victoria

Heidelberg Olympic Village, 1956 – Melbourne, Australia. Used in the 1956 Summer Olympics. Rose Stereograph Co, State Library of Victoria

So how have Australia’s Olympic venues fared? In short, pretty well.

Most Melbourne 1956 Summer Olympic venues such as the Melbourne Cricket Ground (athletics, soccer, hockey, opening and closing ceremonies) and Exhibition Building (basketball, weightlifting, wrestling, modern pentathlon) are still used regularly.

Only the Melbourne Olympic Park Velodrome (cycling, currently a medical centre) and the Merritt Rifle Range (shooting, currently a housing estate) are not in use.

Venues built specifically for the Sydney 2000 Summer Olympics such as the Sydney International Aquatic Centre (swimming, diving, water polo) and Penrith Whitewater Stadium (canoeing, kayaking) continue to be some of the premier locations for their sports in Australia. The Olympic Village is now part of the suburb on Newington.

Some temporary venues such as the Bondi beach volleyball arena were dismantled after the games as planned. The Sydney Entertainment Centre (volleyball) is the only non-temporary venue no longer in use. It was demolished in 2016 as part of the redevelopment of Darling Harbour.

As we head towards the Brisbane Olympics in 2032, careful planning will be needed to ensure that planned infrastructure is cost effective and can be used by local residents, and others, for many years after the games have finished.

This article was originally published on The Conversation. Read it here.

Cheaper mortgages, tamed inflation and even higher home prices: how 29 forecasters see Australia’s economic recovery in 2024-25

By Peter Martin - Visiting Fellow, Crawford School of Public Policy, Australian National University

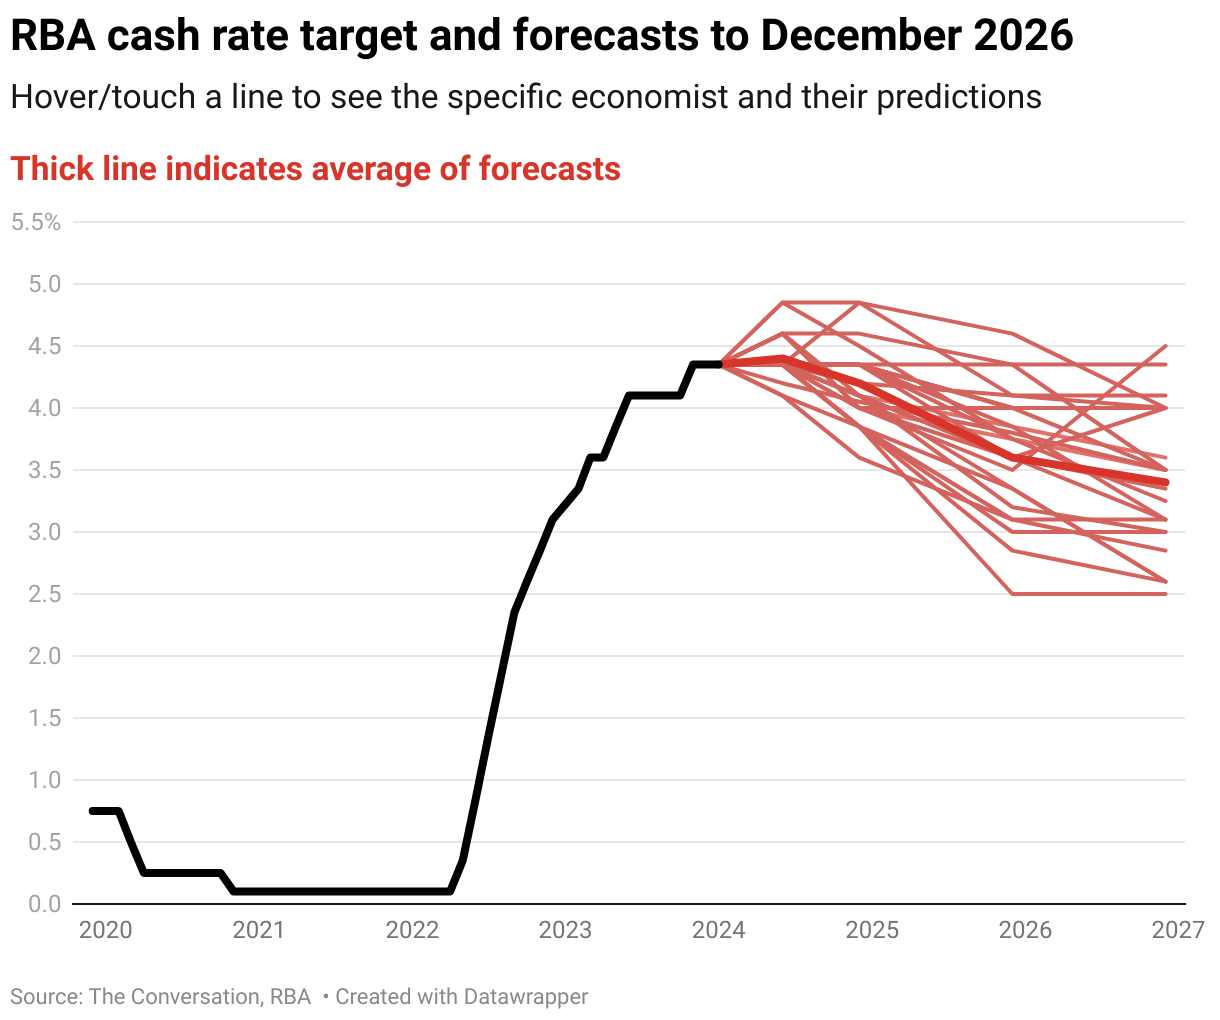
Australia’s top economic forecasters expect the Reserve Bank to start cutting interest rates by March next year, taking 0.35 points of its cash rate by June.

If passed on in full, the cut would take $125 off the monthly cost of servicing a $600,000 variable-rate mortgage, with more to come.

The panel of 29 forecasters assembled by The Conversation expects a further cut of 0.3 points by the end of 2025. This would take the cash rate down from the current 4.35% to 3.75% and produce a total cut in monthly payments on a $600,000 mortgage of $335.

The forecasts were produced after last week’s news of a higher than expected monthly consumers price index.

Several of those surveyed revised up their predictions for interest rates in the year ahead, while continuing to predict cuts by mid next year.

Only one expects higher rates by mid next year. Only four expect no change.

Now in its sixth year, The Conversation survey draws on the expertise of leading forecasters in 22 Australian universities, think tanks and financial institutions – among them economic modellers, former Treasury and Reserve Bank officials and a former member of the Reserve Bank board.

Eight of the 29 expect the first cut to come this year, by either November or December.

One of them is Luci Ellis, who was until recently assistant governor (economic) at the Reserve Bank and is now at Westpac. She and her team are forecasting three interest rate cuts by the middle of next year, taking the cash rate from 4.35% to 3.6%.

Reserve Bank a ‘reluctant hiker’

Ellis says inflation isn’t falling fast enough for the bank to be confident of being able to cut before November. But after that, even if inflation isn’t completely back within the bank’s target band but is merely moving towards it, a “forward-looking” board would want to start easing interest rates.

Another forecaster, Su-Lin Ong of RBC Capital Markets, says in her view the bank should hike at its next board meeting in August after the release of figures likely to show inflation is still too high. But she says the bank is a “reluctant hiker” and keen to keep unemployment low.

Although several panellists expect the Reserve Bank to hike rates in the months ahead, almost all expect rates to be lower in a year’s time than they are today.

The panel expects inflation to be back within the Reserve Bank’s 2-3% target band by June next year, and to be close to it (3.3%) by the end of this year.

Twelve of the panel expect inflation to climb further when the official figures are released at the end of this month, but none expect it to climb further beyond that. And all expect inflation to be lower by the end of the financial year than it is today.

One, Percy Allan, a former head of the NSW Treasury, cautions that the tax cuts and other government support measures due to start this month run the risk of boosting spending and falling progress on inflation.

The panel expects wages growth to fall from 4% to 3.5% over the year ahead, contributing to downward pressure on inflation, but to remain higher than prices growth, producing gains in so-called real wages.

It expects wages growth to moderate further, to 3.2%, in 2025-26.

Consumer spending is expected to remain unusually weak, growing by only 1.7% in real terms over the next 12 months, up from 1.3% in the latest national accounts.

Mala Raghavan, from the University of Tasmania, said even though inflation was falling, previous price rises meant the prices of essentials remained high. AMP chief economist Shane Oliver expected the boost from the Stage 3 tax cuts to be offset by the depressing effect of a weaker labour market.

Unemployment to climb modestly

The panel expects Australia’s unemployment rate to climb steadily from its present historically low 4% to 4.4%.

Moodys Analytics economist Harry Murphy Cruise said although the increase wasn’t big, the effect on pay packets would be bigger. Employers were shaving hours and easing back on hiring rather than letting go of workers.

Panellists expect China’s economic growth to slip from 5.3% to 5% and US growth to slip from 2.9% to 2.4%.

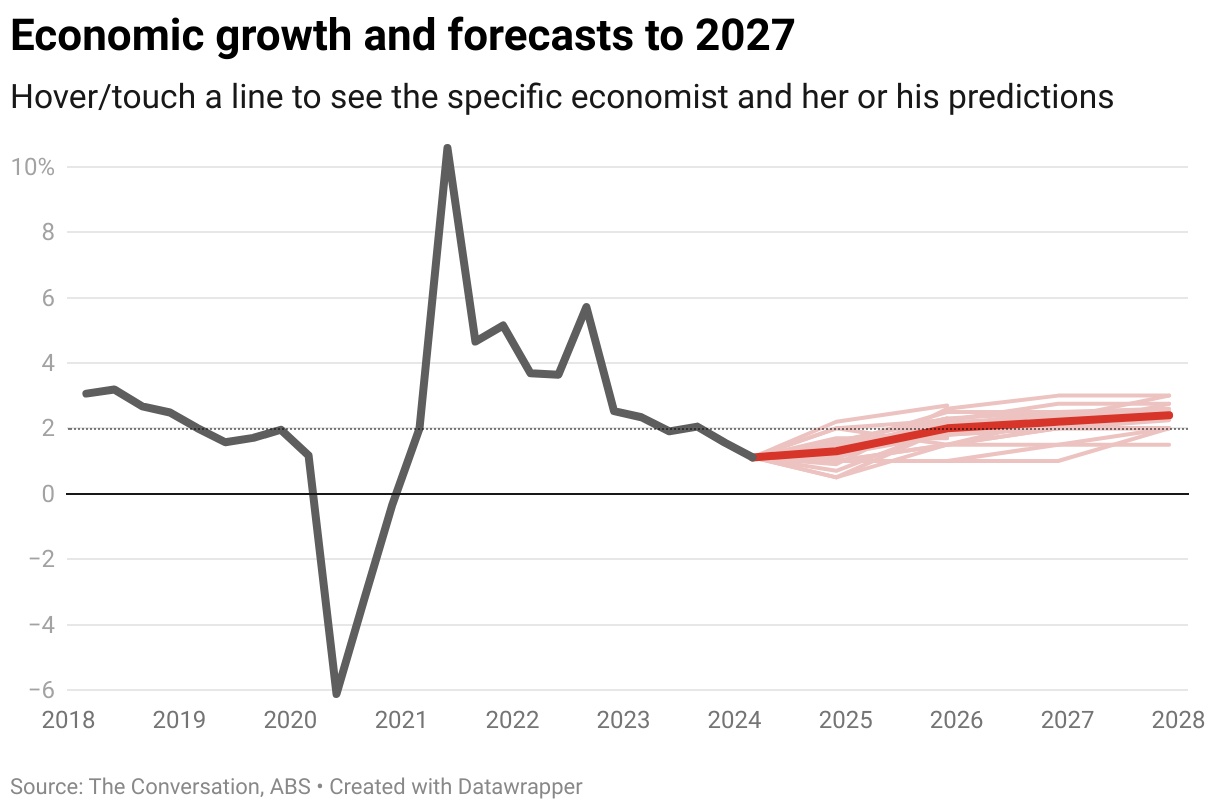
Australia’s economic growth is expected to climb from the present very low 1.1% to 1.3% by the end of this year and to 2% by the end of next year. Although none of the panel are forecasting a recession, most of those who offered an opinion said if there was a recession, it would start this year when the economy was weak.

Some said we might later discover that we have already been in a recession if the very weak economic growth of 0.1% recorded in the March quarter is revised and turns negative when updated figures are released in September.

Home prices are expected to continue to climb notwithstanding economic weakness. Sydney prices are expected to increase a further 5% in the year ahead after climbing 7.4% in the year to May. Melbourne prices are expected to rise a further 2.8% after climbing 1.8% in the year to May.

Percy Allan said Sydney had fewer homes available than Melbourne, and Victoria’s decisions to extend land tax and boost rights for tenants had upset landlords, many of whom were offloading their holdings.

Home prices to climb further

Julie Toth, chief economist at property information firm PEXA, said rapid population growth was colliding with an ongoing decline in household size since COVID. At the same time, fewer new homes were being commissioned and long delays and high construction costs were also keeping supply tight.

The panel expects non-mining business investment to continue to climb in the year ahead, by 5.2%, down from 6.9%.

It expects the Australian share market to climb by a further 5.6%

Read the answers on PDF, download as XLS

This article was originally published on The Conversation. Read it here.

A Big Build or a big bet?

Melbourne’s Suburban Rail Loop aims to help the city become more equitable – but better integration of land use and transport could deliver more benefits for less money

By Associate Professor Janet Stanley, University of Melbourne, and Professor John Stanley, University of Sydney

Melbourne’s current long-term strategic land use plan, defined in Plan Melbourne 2017-2050, is grounded on two core ideas.

These are that Melbourne becomes a polycentric city based on a series of activity clusters, mainly in the middle suburbs (called National Employment and Innovation Clusters – or NEICs) and Melbourne would be organised into a collection of 20-minute neighbourhoods.

The Victorian Government’s Suburban Rail Loop (SRL) is part of the state’s Big Build program. Picture: AAP

The NEICs are intended to promote productivity growth through agglomeration and to develop a more equitable city – particularly by increasing employment opportunities closer to the city’s outer urban growth corridors.

The idea of improving public transport access to middle urban activity clusters has appeal, as a way of supporting their growth potential.

And the Victorian Government’s Suburban Rail Loop (SRL), part of its Big Build program, is intended to play this role.

But this solution is arguably too big for purpose.

Highly developed global cities that have circumferential rail services – that is, trains travelling around an urban area rather than radially to its centre – typically have densities much higher than Melbourne and their circular rail loops are quite short.

Most are also located in the higher-density inner parts of those cities where demand is strongest, whereas circumferential public transport further out typically requires transfers between services.

In 2022, Melbourne’s built-up land area has a population density of 1,746 persons per square kilometre and the SRL has a proposed length of 90 kilometres, from Cheltenham to Werribee.

London’s Circle Line is 27 kilometres long with a much higher population density. Picture: Getty Images

Compare this to London, which data tells us has a population density of 6,504 persons per square kilometre – the city’s Circle Line is 27 kilometres long. Tokyo-Yokohama has a density of 4,584 people per square kilometre, with its Yamanote Line at 34.5 kilometres, and Berlin has 2,934 persons per square kilometre and the 37.5km long Ringbahn.

In short, Melbourne’s SRL is around three times the length of these circle lines, in a city with a much lower population density and a lower patronage potential.

The economics are against the SRL working.

The August 2021 SRL Business and Investment Case for the Cheltenham to Melbourne Airport segment of the SRL (SRL East plus SRL North) showed a positive result, with projected a benefit-cost ratio between 1.0 and 1.7.

However, there are two serious problems with this result.

First, the benefit-cost analysis was undertaken with a low discount rate (four per cent) to convert future benefits and costs over the project’s lifetime into present-day values (this is needed to derive benefit-cost ratios). The usual Australian discount rate for evaluating major infrastructure projects – seven per cent – would have delivered much lower returns for the SRL.

A good argument can be made for using a four per cent discount rate for a project with a long life span, like the SRL, but this is not the usual public policy approach in Australia (unlike in the UK).

The usual Australian discount rate for evaluating major infrastructure projects is seven per cent. Picture: Getty Images

The choice of this discount rate should be subject to wide debate, including consideration of implications for the evaluation of alternative investment opportunities whose impacts accrue over shorter time frames.

Second, as well documented in the media, the expected cost of the project has increased substantially. The cost was estimated at around $AU50 billion for the full project at the initial announcement in 2018, rising to $AU35-57 billion for SRL East plus North in the Business and Investment Case.

The figure now stands at $AU125 billion again for SRL East plus North, as estimated by the Victorian Parliamentary Budget Office.

This would take the capital cost for the full SRL to around $AU200 billion, or about four times the initial estimate made only a few years ago.

Unfortunately, the expected benefits do not grow anywhere near as quickly as this rate of cost inflation. If evaluated today with a more usual discount rate, the SRL would struggle to generate even 50 Australian cents of benefit per dollar of capital cost.

This should be a cause for concern.

Medium capacity transit (MCT) solutions, as proposed by the Rail Futures Institute, are likely to be a more cost-effective and flexible solution to meeting the circumferential public transport accessibility needs of Melbourne’s middle urban clusters in a faster timeframe.

The expected benefits of the SRL do not grow anywhere near as quickly as the rate of cost inflation. Picture: Shutterstock

This kind of cluster development could then be further enhanced by direct investment in cluster competitive strengths – like supporting further growth of their universities and hospitals or medical research facilities – together with investing in place-making.

These investments plus MCT would be a more integrated way of promoting polycentric growth in Melbourne than relying so much on the SRL.

The savings from not pursuing the costly development of the SRL could also be used to promote a much faster roll-out of the distinctive and very innovative Plan Melbourne idea of 20-minute neighbourhoods; this concept has been taken up by many European cities as well as others in Asia, Canada, South America and recently, Singapore.

A 20-minute neighbourhood offers most services that most people need most of the time, including shops, schools, health services, parks and recreation.

This form of land use reduces urban sprawl through higher-density housing, builds community and fosters social capital, improves accessibility and offers a greener environment.

As a result, the likely outcomes are improved health and wellbeing, increased social inclusion and increased economic productivity, along with a reduced need to travel, which also helps to reduce transport emissions.

The Victorian Government is trialling 20-minute neighbourhoods in Melbourne. However, these trials have overlooked the public transport component, instead relying on walking and cycling.

The Victorian Government is trialling 20-minute neighbourhoods but have have overlooked public transport. Picture: Getty Images

An 800-metre catchment, as used in the trials, and said to be an acceptable walking distance, is unlikely to offer access to many service needs. This dependence on active transport doesn’t offer equality in opportunity for all people, potentially leaving out many older people, those moving or carrying heavier loads, people with an impairment and people with multi-tasking requirements – like work, child-care and school drop-offs, shopping and the list goes on.

A larger neighbourhood is required to offer essential services, supported by a frequent neighbourhood local public transport service.

Improving circumferential public transport access to serve Melbourne’s middle urban clusters is an important requirement for delivering the city’s intended land use development. But the Suburban Rail Loop is an expensive solution to this challenge.

It comes at the cost of other important infrastructure and service improvements that are likely to be effective in reducing inequality and facilitating growth with lower emissions.

Medium Capacity Transit options plus direct investment in cluster development is a more cost-effective way forward, complemented by a greatly accelerated rollout of 20-minute neighbourhoods across middle and outer urban Melbourne, at increased densities.

This would give Melbourne big benefits without such a big bet.

This article was originally published on the Pursuit. Read it here.

Prefabs and the ‘missing middle’: how to get Australia back on track to build 1.2 million homes in the next 5 years

By Dr. Parisa Ziaesaeidi, Associate Lecturer in Architecture, Western Sydney University

Dr. Parisa Ziaesaeidi is an architect with experience in both academia and industry. She holds a PhD from the Queensland University of Technology in Australia. In addition, Parisa is an Associate Fellow of the UK Higher Education Academy. Her research interests focus on social sustainability, large and small-scale built environments and neighbourhood design.

The National Cabinet set an ambitious target of building 1.2 million well-located homes over the next five years to tackle Australia’s housing crisis. The focus of the National Housing Accord is on complementary development that improves existing neighbourhoods. This includes infill development on vacant or underutilised land in established urban areas.

Infill development uses existing infrastructure and avoids urban sprawl. It can create more compact neighbourhoods with diverse housing choices.

Well planned and designed infill development makes it easier for residents to use public transport and active transport such as cycling and walking. It also reduces the loss of native vegetation and farmland. It’s generally a win for the environment, people and the public purse.

The question is how can Australia achieve its housing target? The current rate of construction is too slow to deliver 1.2 million homes by July 2029. And can we do so in a way that meets people’s needs and preference for medium-density housing rather than ultra-dense high rises?

The answer is to build so-called “missing middle” housing types such as low-rise apartments, townhouses and duplexes. Prefabricated construction can deliver this sort of housing much more quickly.

Federal Industry Ministry Ed Husic, who is hosting a roundtable today on the role prefabricated housing can play in achieving the target, said:

We know that this gives us a great opportunity to use advanced technology to build these homes. Prefabs have come a long way from what people used to associate them with and they’re providing really quality solutions.

The missing middle: a crucial component

Development in Australia tends to gravitate toward either low-density urban sprawl or ultra-dense, high-rise development. While medium-density development exists, it’s missing from the housing mix in many areas.

Missing middle housing fills the gap between large family houses and high-rise apartments. It’s an important step toward supplying enough well-located housing in our cities.

Low-rise apartments, townhouses and duplexes can help Australian cities grow through inside-out, medium-density development. Cities then won’t have to spread out to house growing populations.

The missing middle may be more affordable for residents such as young professionals, small families and seniors. Building this housing in established neighbourhoods will, in turn, improve their social mix.

Prefab offers speed and affordable quality

Prefabricated housing can be important for delivering this missing middle. By making construction more efficient, it can produce more affordable homes. And reducing waste makes the homes more sustainable.

Only about 5% of Australian housing is prefabricated. Wild Modular/AAP

Precise manufacturing in controlled factory conditions means prefab homes can be more consistently high quality than those built on site. And they can be built in weeks rather than months.

Off-site production also reduces construction activities on the housing site. There’s less noise, traffic and nuisance for neighbours.

This is good for urban areas where housing demand is high and solutions are urgently needed.

Yet only about 5% of new housing is prefabricated in Australia. In contrast, 84% of new houses in Sweden use prefabricated elements.

A proven approach overseas

Experience overseas shows how medium-density prefab can deliver more housing that’s accepted by the community.

A shining example is the Stanley 1351 in Los Angeles, California. It’s an innovative development in an area where space is limited and neighbourhood disturbances must be minimised. It uses prefabricated modules to construct medium-density housing.

The result is a dynamic urban centre with a wide choice of housing types. Its thoughtful design and quality construction enhance the community. The development also minimises carbon emissions.

This approach needs policy support

To realise the goals of the National Housing Accord, governments and everyone else involved in housing construction must work together to develop comprehensive policies. This policy framework should enable the use of emerging construction technologies such as prefab and modular housing.

Moving beyond the prefab stigma requires a multi-pronged approach. Projects will have to be designed, built, financed and executed to have a permanent, high-quality look and feel. They should fit right into the streetscape.

Stanley 1351 demonstrates how prefab construction can do this. The new homes are integrated with the surrounding architecture, making them more welcoming to residents.

As Ed Husic acknowledges, public doubts about the long-term viability of prefabs must also be overcome. Certification of compliance with building codes and standards is a way to ensure structural integrity, durability and safety.

The crucial goal of increasing the supply of homes depends on integrated strategic planning that encourages innovative and efficient methods to achieve good outcomes. This means creating vibrant, sustainable and desirable communities that meet diverse housing needs.

Strategic and participatory planning done well can help uphold people’s fundamental right to housing. Planning that encourages the demonstration and widespread adoption of prefab and modular methods can play an important role in achieving these housing goals for Australians.

This article was originally published on The Conversation. Read it here.

How many 20-minute neighbourhoods does Melbourne really have?

Walkable cities are gaining traction. Our Map of the Month shows which Melbourne suburbs are walking distance to childcare, pharmacies and GPs

By Dr Kerry Nice, Dr Sachith Seneviratne and Professor Mark Stevenson, University of Melbourne

Choosing where to live is a complex decision. You need to balance finding somewhere that’s affordable, is suitable for your housing needs, is a convenient location and has nearby services and amenities.

But what services and amenities do you need, and how close do they need to be?

A 20-MINUTE WALK AWAY

Twenty-minute neighbourhoods feature in many Australian planning strategies like the Victorian government’s Plan Melbourne 2017-2050.

The 20-minute neighbourhood grew from the concept of the 15-minute city. This is a city that promotes higher density, mixed-use development and emphasises active transport (like walking or bike riding) to reach work, shopping, education and entertainment.

This concept gained popularity during COVID-19, with many global cities – like Barcelona, Paris, Milan and Madrid – publishing plans to encourage the types of urban development needed for 15-minutes cities.

For example, Barcelona has been building ‘superblocks’ where they ban or restrict cars to create zones of increased public space conducive to walking and cycling.

This has brought with it considerable health and economic benefits.

WHAT IS A 20-MINUTE NEIGHBOURHOOD?

Imagine you lived somewhere where almost everything you need in your day-to-day life is 20 minutes away. If you needed to see a doctor, shop for groceries, visit greenspace or a park, or go to work – it is all just a 20-minute walk or bike ride away.

The Victorian plan for a 20-minute neighbourhood has six hallmarks:

  1. Safe, accessible, and well-connected

  2. Supportive of local economies

  3. Provide convenient access to services

  4. Are climate resilient

  5. Provide high quality public spaces

  6. Housing density that make a 20-minute neighbourhood viable

But a 20-minute neighbourhood isn’t one-size-fits-all. Different people at different stages in their lives will consider some features essential to their needs, and others may be superfluous.

A retiree might rank access to GPs or community centres high, while a young family will put more value on access to nearby childcare and schools.

IS MELBOURNE A 20-MINUTE CITY?

Melbourne is often ranked one of the world’s most liveable cities (number three in 2023), with Melbourne’s inner north recognised as having the coolest street in the world.

But Greater Melbourne is a large and diverse city, with huge variations between its higher density inner-city neighbourhoods and its much lower density suburbs and peri-urban regions.

For our Map of the Month, we looked at access to various services across Melbourne – specifically childcare centres, primary health GPs and pharmacies – to determine how many neighbourhoods are truly 20-minute.

This work is based on a project we are completing for the ARC Centre of Excellence for Children and Families over the Life Course to map spatial disadvantage when it comes to access to services across Melbourne and Perth.

To accomplish this, we conducted a ‘shortest path’ analysis from every intersection in Greater Melbourne (about 500,000 points) to count the number of these services that can be reached within a 20-minute walk (or 1,600 metres).

Using this data, we created an index of accessibility to childcare, GPs and pharmacies for each suburb across Greater Melbourne (see our Map of the Month at the top of this story).

Most inner and middle suburbs in Melbourne seem to have broad access to these services within 20 minutes. However, access drops off towards the fringes, with peri-urban areas having low to no 20-minute access to these services.

Childcare seems more evenly distributed across the city than GPs and pharmacies.

When we look in more detail at certain areas, and include the number of each service available within a 20 minute walk, we can see that many of the inner and mid-city gaps are in areas with large parks, green space, creek corridors and green wedges around the edges of the city.

At this level of detail, there are some notable gaps in suburbs along the Frankston train line, in the predominately industrial areas of Port Melbourne and Altona, and towards the high-growth areas in western Melbourne.

Suburbs like Frankston and Mornington show small pockets of high availability surrounded by large areas of low to no access.

The corridor from Altona through Newport to Port Melbourne varies greatly, with some large gaps in coverage.

The implications of this are clear. Some areas are well serviced while neighbouring areas miss out. Areas like Fishermans Bend are planned to support large increases in residential populations, but currently there are very few services available to provide new residents a 20-minute neighbourhood.

This risks building car-dependency in these areas.

We should note that our analysis only measured the presence of a service but not its capacity – like whether a childcare facility can accommodate the local demand.

Our research continues to explore what needs to be done to ensure that our 20-minute neighbourhoods not only have the services that are needed, but that there is a match between the number of local residents who need to use them and the capacity of these childcare facilities, pharmacies and GPs to provide them.

There are also many other elements of 20-minute neighbourhoods that need to be examined: access to art and culture, nearby public transportation, provisions for active transport and the list goes on.

But of course, none of this is any use to most residents without suitable affordable housing in these areas.

Map of the Month is a science communication project of the University of Melbourne (Melbourne Centre for Cities, AURIN, Melbourne Data Analytics Platform and Pursuit) using maps to spark important policy conversations across metropolitan Melbourne. This pilot is supported by the Lord Mayor’s Charitable Foundation and in partnership with the Victorian Office for Suburban Development and the Municipal Association of Victoria. Academics, community leaders and government representatives from across Melbourne contribute to the maps and accompanying stories.

This month’s story was produced with support from the the ARC Centre of Excellence for Children and Families over the Life Course, and the map was produced by Dr Sachith Seneviratne, Flavia Barar and Dr Emily Fitzgerald. Childcare data is from ACECQA and pharmacy and GP locations from the National Health Directory.

This article was originally published on The Pursuit. Read it here.

Oliver's insights Australian home prices were up again in May – but the tension between high rates and the chronic housing shortage remains

By Dr Shane Oliver - Chief economist and head of investment strategy at AMP

Key points

- CoreLogic data showed national average home prices rose 0.8% in May, their strongest rise since last October.

- The housing market remains remarkably resilient with the housing shortage and still solid jobs market providing support, offsetting the downwards pressure on prices from high interest rates and poor sentiment towards housing.

- We expect home prices to rise around 5% this year as the supply shortfall continues to dominate, but the pushing out of rate cuts and the possibility of rate hikes along with the rising trend in unemployment pose a key downside risk.

- Home price gains are likely to remain widely divergent though with continued strength likely in Perth, Brisbane and Adelaide for now partly helped by interstate migration but softness in other cities, particularly Melbourne and Hobart.

Introduction

National average home prices rose another 0.8% in May, pushing them further into record territory. However, the gains remain highly diverse. Conditions in Perth, Brisbane and Adelaide continue to be very strong, helped by relatively lower levels of supply evident in total listings running more than 30% below their five-year averages, and strong interstate migration in the case of Brisbane and Perth. But this contrasts with far more constrained conditions elsewhere. Sydney has made it back to its record high but only just and the other capitals remain well below their record highs. Melbourne and Hobart are seeing total listings well above their five-year average.

After overtaking Melbourne median property values in January, Brisbane has now overtaken Canberra to have the second highest median property values amongst Australian capital cities. Sydney remains at the top. Of course, the surge in prices in Brisbane, Adelaide and Perth will in time worsen their attractiveness for interstate migration eventually leading to slower property price growth in those cities.

The chronic housing shortage continues

The property market remains caught between the extreme housing shortage and high interest rates, with the former continuing to dominate. The chronic housing shortage got the upper hand over high interest rates last year as immigration levels surged and continues to be the main driver of rising property prices. Put simply, the surge in population growth to a record 660,000 over the year to the September quarter last year driven by record immigration levels meant that around an extra 250,000 new homes needed to be built, but instead completions have been running around 170,000 as the home building industry struggles to keep up with rising costs and material and labour shortages and as approvals to build new homes fell.

So underlying demand for housing (the blue line in the next chart) has been very high over the last two years relative to housing completions (the red line) resulting in an annual shortfall of around 90,000 dwellings in 2022-23 and another 80,000 dwellings this financial year (ie, the gap between the blue and red lines).

This is estimated to see the accumulated housing shortfall rise to around 200,000 dwellings by the end of this month. See the next chart. This is a conservative estimate – if the decline in the average number of people per household seen in the last few years is sustained then the accumulated shortfall could be around 300,000 dwellings. Which would be well above where we were before the unit building boom got underway around 2015.

Unfortunately, the housing shortfall looks like it will get worse before it gets better. Immigration levels are likely to slow over the year ahead but still remain high and housing construction is likely to remain depressed in the face of cost pressures and capacity constraints. In fact, approvals are now running around 160,000 new dwellings a year, which is well below government objectives to be building 240,000 dwellings a year over the five years from July.

At the same time, access to “the bank of mum and dad” and savings buffers built up through the pandemic appear to have protected the property market from high rates over the last two years. Anecdotes suggest that all cash purchases and access to “the bank of mum and dad” reached a record last year.

But there is now a high and widening gap between home prices and the capacity to pay

The big negative influence on the property market remains poor and still worsening affordability and high mortgage stress on the back of high prices, high debt levels and high mortgage rates. For decades ever rising property prices relative to incomes were made possible by ever lower interest rates. But due to the rebound in interest rates from May 2022 and national average home prices on the rise again there is now a wide divergence between buyers’ capacity to pay for property and current home prices – with the capacity to pay down by 27% on our estimates since April 2022. See the next chart. In the absence of rapid interest rate cuts this continues to point to a high risk of lower property prices at some point. This is reinforced by ultra-low sentiment towards property. A sharp rise in unemployment in response to weak spending in the economy would add to the downside risks flowing to property prices from high mortgage rates.

Outlook

However, for now the supply short fall continues to dominate. So, after an average 8% gain last year, we expect that national average home prices will rise again this year but with national average gains a bit more constrained at 5% as still high interest rates act to restrict demand and rising unemployment boosts distressed listings. The supply shortfall points to upside risk, but the delay in rate cuts and talk of rate hikes risks renewed falls in property prices as it’s likely to cause buyers to hold back and distressed listings to rise.

Home price gains are likely to remain widely divergent though with continued strength likely in Perth, Brisbane and Adelaide for now partly helped by interstate migration but softness in other cities, particularly Melbourne and Hobart.

Some signs of softening

Interestingly, there are some signs of a softening at the margin: auction clearance rates have cooled from their highs; new listings are up sharply in some cities possibly reflecting rising distressed listings; and after leading early in the property upswing, top quartile property price gains are the weakest in most capital cities as affordability and borrowing constraints are starting to bite pushing buyers into lower-priced property.

This article was originally published on AMP Insights. Read it here.

You many also be interested in this article - Econosights: The Australian generational wealth divide

Sky-high vanity: constructing the world’s tallest buildings creates high emissions

By James Helal, Assistant Dean (Sustainability), The University of Melbourne and Dario Trabucco, Associate Professor, Building Technology, Università Iuav di Venezia

Since ancient times, people have built structures that reach for the skies – from the steep spires of medieval towers to the grand domes of ancient cathedrals and mosques. Today the quest is to build the world’s tallest skyscrapers, such as Burj Khalifa in Dubai. Soaring above the rest, its decorative spire accounts for 29% of its total height – 4,000 tonnes of structural steel just for aesthetics.

Burj Khalifa isn’t unique in this respect. “Vanity height” – the extra height from a skyscraper’s highest occupied floor to its architectural top – shapes city skylines around the globe.

In a world where environmental concerns are paramount, is such architectural vanity justifiable?

Our research shows the pursuit of “vanity height” makes this a pressing issue. Even a modest spire increases the carbon emissions from the production of materials for a skyscraper’s structure by about 15%.

Building tall is not just about architecture; it’s big business. Being ranked among the world’s tallest buildings can transform an otherwise ordinary skyscraper into a globally recognised icon. This creates an incentive to add vanity height.

Our proposed solution is to rethink the global standard for ranking the world’s tallest buildings.

A matter of measurement

The way we measure the height of skyscrapers is at the heart of this issue. The Council on Tall Buildings and Urban Habitat (CTBUH) is the ultimate authority on skyscraper heights. It bestows the coveted title of “world’s tallest building”.

Historically, there wasn’t much debate over skyscraper heights as early buildings typically had flat roofs. The first significant issue arose in 1929 when the Chrysler Building in New York City installed a last-minute spire, securing the self-proclaimed title of the “world’s tallest building” over the Bank of Manhattan.

The Council on Tall Buildings and Urban Habitat, founded in 1969, established criteria in the early 1970s that included decorative spires. This formalised a practice that would be contentious time and again.

A landmark moment in the council’s history was the 1998 showdown between Petronas Towers in Kuala Lumpur and Sears Tower in Chicago, now known as Willis Tower. Imagine these two giants side by side: the pointy spires of the Petronas Towers, with 88 floors, and the flat-topped Sears Tower, with 108 floors. But the council uses “height to architectural top”, which includes decorative spires. As a result, it declared Petronas Towers the tallest building in the world, outstripping Sears Tower for the title.

Back in Chicago, this was not a popular verdict. Picture the folks on the 108th floor of the Sears Tower looking down at the celebrations on the 88th floor of the Petronas Towers, perplexed by how those extra metres of spire made the difference. The decision even made its way into popular culture with Jay Leno joking on The Tonight Show:

All the council does is, once every ten years, they look up in the sky and say, ‘Yep, that’s the tallest!’

Even if extra height does not secure a place among the world’s top 100 tallest buildings, height still matters. Skyscrapers gain valuable prestige as the tallest in their city, region or country, or by earning use-specific accolades like “world’s highest restaurant” or “world’s highest religious space”.

The hidden cost of vanity height

Sixty years ago, the renowned Bangladeshi-American architect and engineer Fazlur Rahman Khan demonstrated the exponential impact of a building’s height on the amount of material needed to build it. Indeed, doubling the height of a building could triple the structural materials required. A stronger structure, using more materials, is needed to withstand greater wind and earthquake loads on taller buildings.

This means there’s a large “embodied carbon premium for height”. This premium is the additional greenhouse gas emissions from producing the extra materials needed for a taller skyscraper.

A telling example from our study shows that even a modest spire, making up 16% of a building’s total height, can increase the embodied carbon of a 90-storey skyscraper by 14%. In maximising the building’s height for aesthetic, status or financial reasons, designers are prioritising these concerns over environmental sustainability.

We took a detailed look at Dubai, a city celebrated for its towering skyline. We found the collective vanity height of its 100 tallest buildings adds up to more than 3.5 kilometres.

We estimate these decorative elements contributed at least 300,000 tonnes of greenhouse gas emissions. That’s both the direct embodied carbon of the spires and, much more importantly, the embodied carbon added by reinforcing the buildings to support the extra structural loads.

To put this impact into perspective, 300,000 tonnes of emissions is equivalent to the embodied carbon associated with building about 2,400 average Australian homes. It’s a hefty price to pay, simply to adorn 100 skyscrapers with pointy hats that inflate their heights and status in global rankings.

Redefine heights to set more sustainable standards

The Council on Tall Buildings and Urban Habitat, which champions the motto “Towards Sustainable Vertical Urbanism”, has a crucial opportunity to lead change. What if it revised how we measure and rank tall buildings to better reflect this commitment to sustainability?

In light of our findings, we call on the council to remove the incentive for vanity height. We propose the “height to highest occupied floor” be adopted as the main standard for ranking skyscrapers by height.

Such a change may be controversial. Burj Khalifa would keep its title as the world’s tallest, but One World Trade Center with a vanity height of 155 metres, for example, would drop nine places, losing its status as the tallest in North America.

However, for every building that falls in the rankings, others will rise. Our research shows there are more winners than losers among the 100 tallest buildings worldwide. So support for this change could outweigh resistance.

Cities continue to grow and environmental challenges are becoming more acute. The need to re-evaluate our approach to architectural design is becoming ever more pressing. In particular, vanity architecture features like excessive decorative spires burden not only our skylines but also our environment.

Ultimately, we’re all better off if we change how we rank the world’s tallest buildings.

This article was originally published on The Conversation. Read it here.

Ways to improve the quality of life in Australia’s fast-growing cities

Having worked on strategic planning with over 400 global cities, Professor Greg Clark explains what Australia needs to address with its own population growth.

CBRE provides thoughtful, forward-looking insight into real estate trends, strategies and opportunities around the world.

Today’s global cities are expanding as deeper epicentres for human activity and endeavours beyond the traditional work hub. 

UN figures suggest that almost 10 billion people will live in about 10,000 cities globally by 2100. For Australia, the government's 2023 Inter-generational Report predicts that 40 million people will live here by 2061 or sooner, with the population rising by 15 million over the next 36 years. This is the equivalent of the current populations of Geater Sydney, Metro Melbourne, Brisbane and South-East Queensland, and Metro Perth being re-added in that time span. 

This broaches the critical question of how our existing cities will adjust to this population growth, meeting the demand for essential infrastructures and amenities tied to the ideals of sustainable work, life, and play.  

One of the world's leading urbanists, Professor Greg Clark, has some answers. Having worked on strategic planning with over 400 global cities, including London, New York, Paris, Sao Paulo, Barcelona, Hong Kong, Singapore, and Shanghai, Clark is an authority in explaining how Australia can tackle its rapid urbanisation curve.  

Together with CBRE's New South Wales Director of Government and Industry, Ash Nicholson, the duo addressed everything from Australia’s current housing shortage to the future of work to blueprinting a successful 24-hour economy.  

Options for a successful city 

Accommodating for population growth is one of the key challenges in Australia amidst an ongoing housing supply crisis. Clark says that if Australia is to add another 15 million people over the next 36 years, there are only four options to consider. 

  1. Let sprawl be unbound and allow every city to expand outwards 

  2. Build new cities in fresh locations, as was done historically with Canberra 

  3. Enable existing cities to densify and become higher within their current city limits 

  4. Connect cities and towns better with enhanced transport to build a networked model of distributed densification with more compact cities and towns working together. 

These options are not all mutually incompatible as Clark indicates. 

"If you look around the world, the model that's being pursued in the cities that are doing really well is a combination of option three and four in my model,” says Clark.  

“Think Singapore, Vienna and Nordic cities like Stockholm, Oslo and Helsinki. They're building new infrastructure to enable smaller cities and towns that are close to large cities to develop, optimise and become specialist locations. That infrastructure in turn enables a larger overall housing market, labour market, investment market, and infrastructure platform. And when they do all of that, they usually combine it with densification in the city centre as well.”  

These are the models that appear to work in cities that can provide affordable housing on a larger scale with specialist locations for new industries and a high amenity set for its citizens.  

“We've come to the point in our century of urbanisation where the existing models that cities have been using have become saturated. What we must do is break out of the existing model by adding new dimensions to the city, often by creating additional locations within the same metropolitan area.”

Revaluating the great Australian dream 

Will the great Australian dream of owning a family home with a backyard meet its demise in the future? While it’s harder for home buyers to secure a freestanding home on a block of land nowadays, it’s not impossible, according to Clark. 

“Urban populations are elastic and they're growing very fast. Urban land is inelastic and finite. If you have a model that uses the car as the main form of transport and has the main form of living as the quarter acre block with single-family home, the only way you can grow the population with that model is through sprawl.  

“The problem with sprawl is that it produces very high commuting times and very low amenity sets. It leaves people very dissatisfied and it's bad for productivity and health as populations grow. It's almost bad in every way.” 

Clark believes the solution is to break out of that mould without needing to abandon the appeal of the nice family home in a well-facilitated suburb entirely.  

“You have to complement it with other things. You need to densify and improve the amenity set in your towns so that the suburbs surround towns where there's good amenities, great connectivity, reliable public transport with high capability and capacity.  
 
“If you can do that, you achieve what I call a cohabitation of the old model of low density living in suburbs, with medium density living in connected towns. This is in tandem with high density living in city centres, which can provide different kinds of amenities and choice. This combination provides more choice overall. 

“I don't think you have the option simply to continue with the Australian model of the owner-occupied single-family home with every journey being by car.” 

Defining the future of work 

There’s little doubt that the pandemic has permanently changed the way that millions work around the world. It’s why the experience factor has become such an important tool in today’s dynamic work environment.  

“It's the experience of being at work, the experience of the office, the experience of the district around the office, and the experience of the journey to the office that we have to work on,” says Clark.  

“The net effect of the pandemic on cities was a shift away from them simply trying to service corporates, consumption, and commuters, towards being hubs for habitat, innovation and experience.”   

Cities, he suggests, have their long-term value-add tied to their ability to be great places to live, innovate with new value creation, and host enriching experiences. 

This means innovations like the ability to curate new creative and productive activities, as well as focusing on the quality of experience offered to people.   

"If the experience is not engaging and fulfilling, people won’t want to come into the office. If given the choice, they'll choose not to.” 

Creating the 24-hour economy 

The notion that cities are no longer just destinations for workers and commuters highlights the topic of 24-hour economies and how to successfully foster them. In New South Wales alone, there is already strong leadership helping to build an economy around the clock. 

“Politically, we have a minister with arts, music, nighttime economy, and roads. This shows the focus on connectivity,” says Nicholson. 

“We have a dedicated 24-hour economy commissioner with an expanding team and remit. Most importantly, we have a 24-hour economy plan.  

“The ongoing misconception around the 24-hour economy is that it's only about entertainment and going out at night, but it's so much more than that.  

“It's the key workers that keep our city optimised at night. It's the healthcare workers, the supply chain workers, and of course the cultural and place factors that really make people attracted to live, work, and play in a location.”  

This article was originally published on CBRE. Read it here.

‘Bumping spaces’ build community – when they are within reach

Social connection needs time and effort, but crucially it also needs meeting places, and our Map of the Month highlights that not all Melburnians have equal access to these ‘bumping spaces’

By Professor Jane Farmer, Tracy De Cotta and Dr Milovan Savic, Swinburne University, Professor Andrew Butt and Dr Annette Kroen, RMIT and Associate Professor Lucio Naccarella, University of Melbourne

When was the last time you visited your local library, community centre or neighbourhood house?

Perhaps it’s not near enough even to think about going there, or life feels just too exhausting after your commute, taking the kids to school and working long hours to make ends meet. Maybe it seems like something other people, not you, can do.

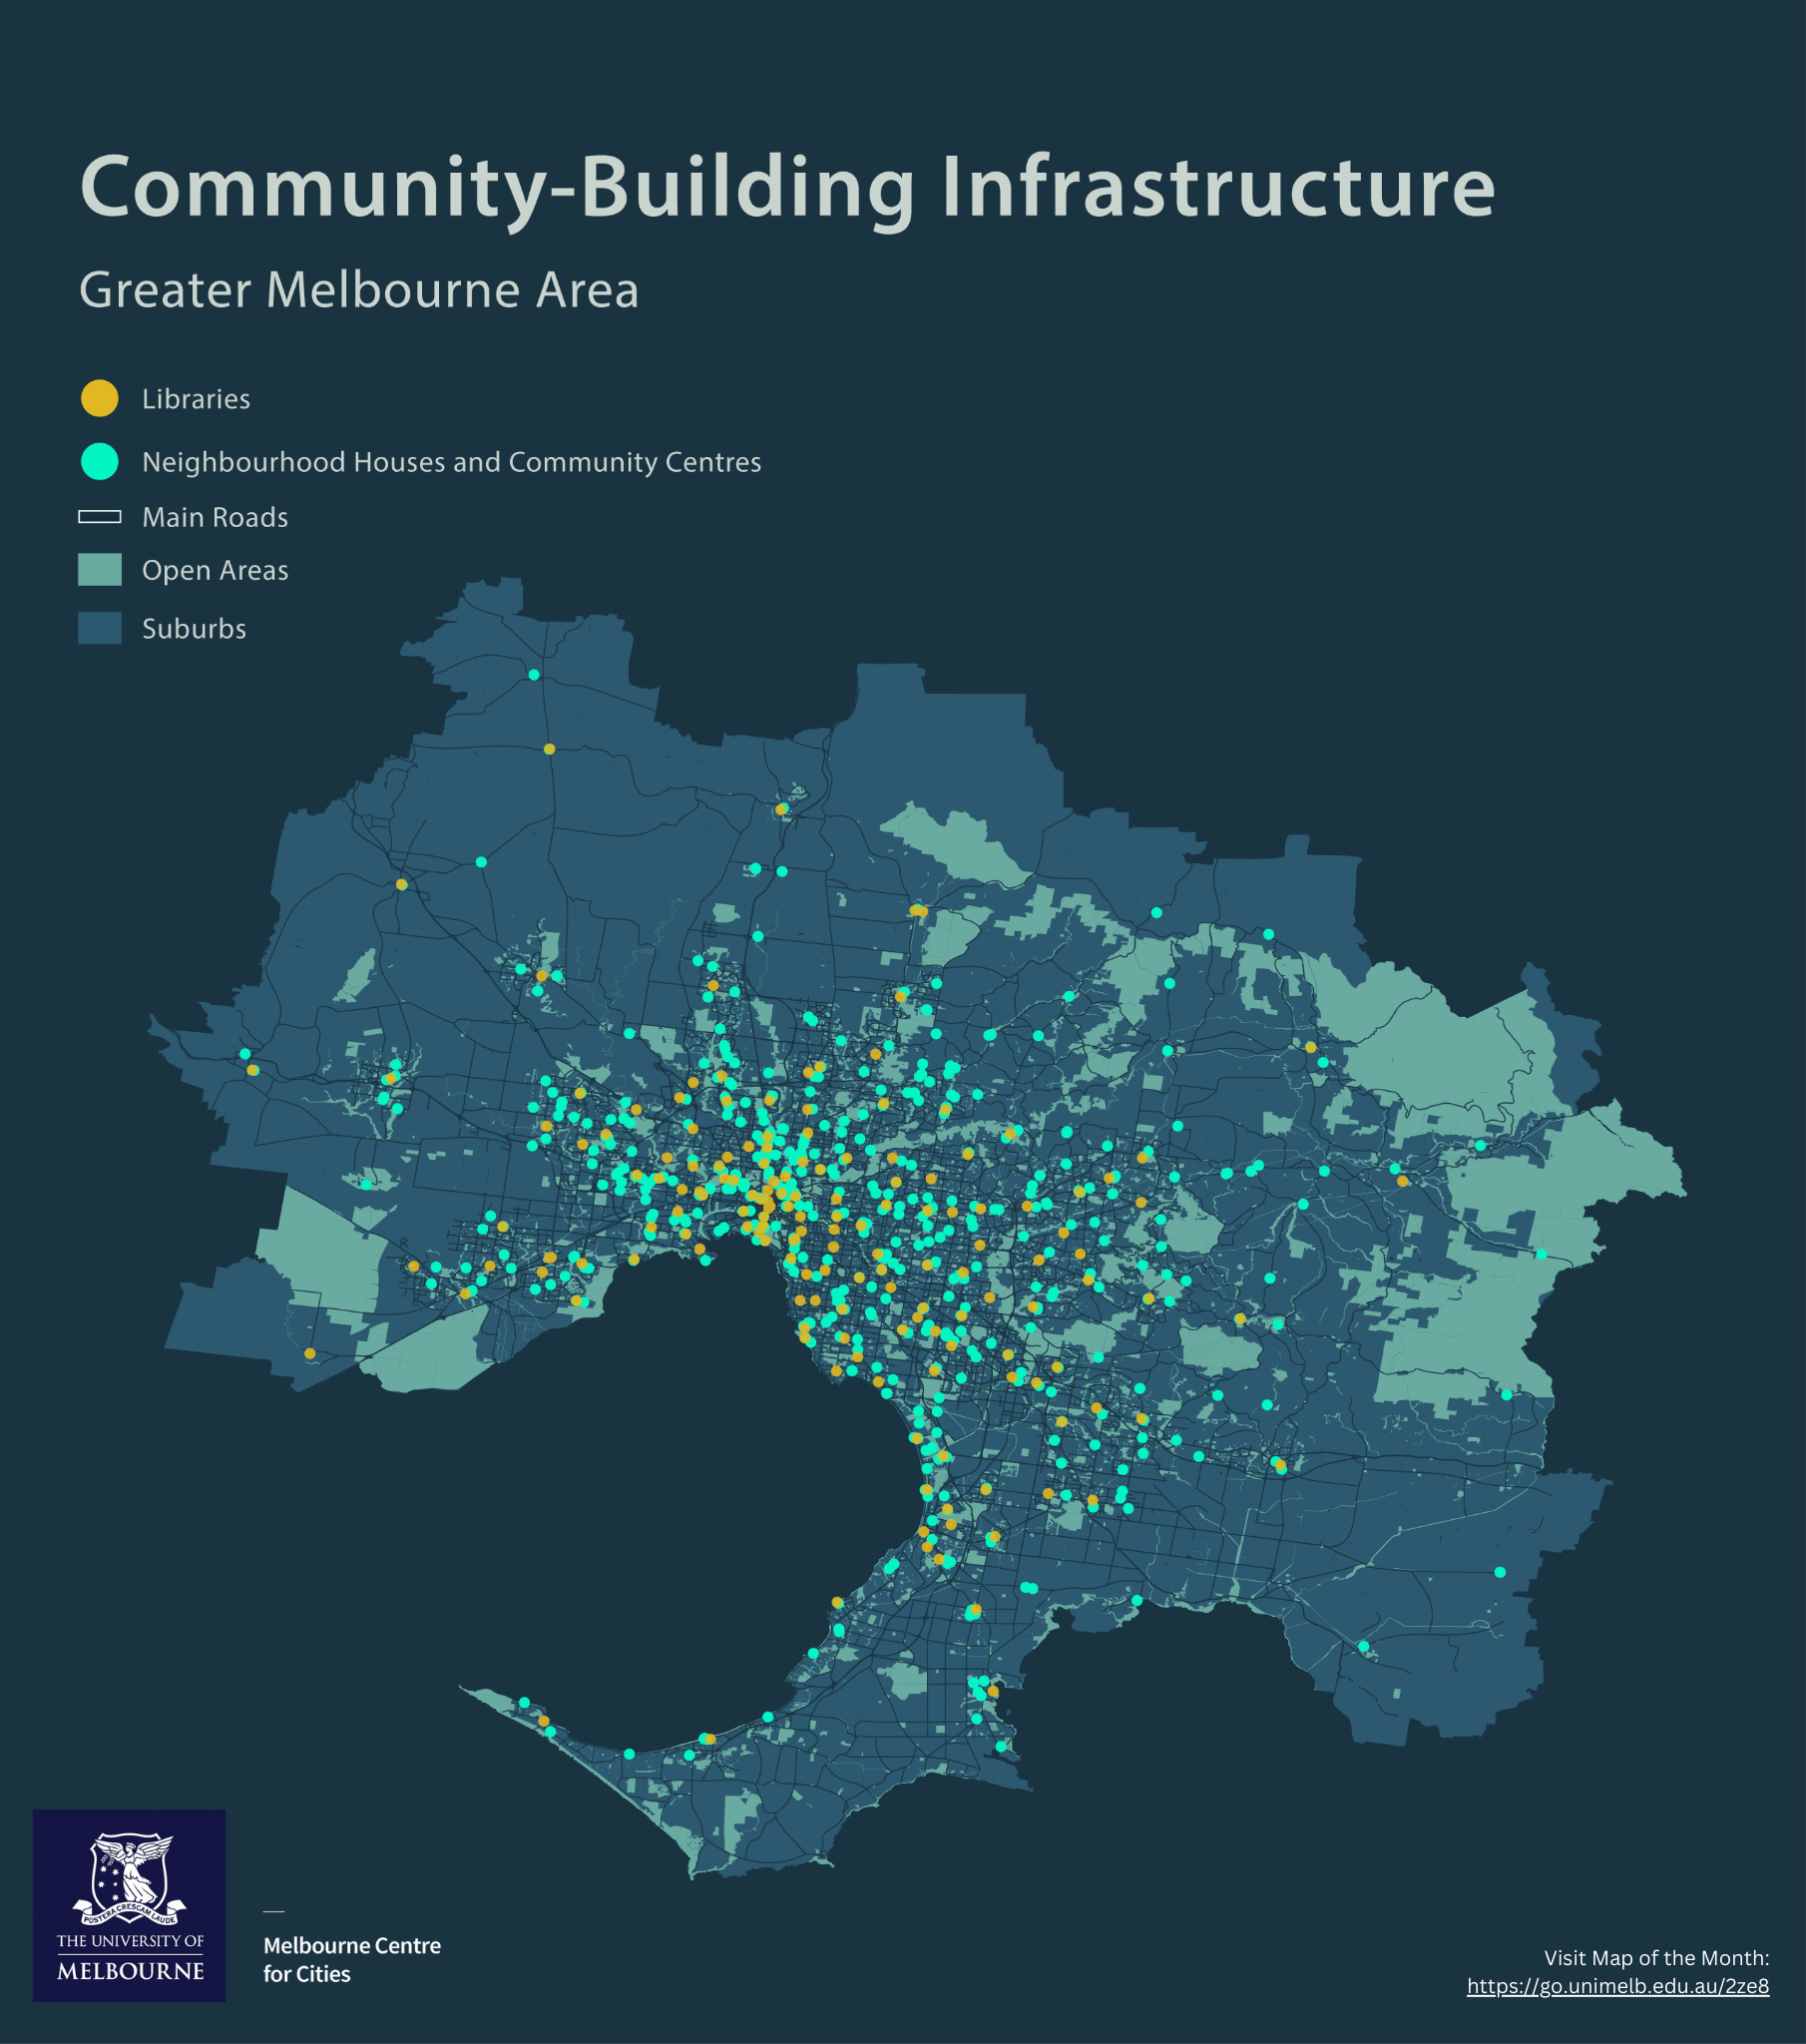
Our Map of the Month shows key ‘bumping spaces’ – libraries, neighbourhood houses and community centres – in Greater Melbourne. Picture: Map of the Month project

But these kinds of community hubs are excellent places for fostering ‘social connection’. Social connection is a complex experience fundamental to people’s health and wellbeing, and a way to form ‘connected communities’ with the capacity to mobilise in an emergency or to support locals in need.

We all need interaction with other people, and people who are socially connected report being happy with their social support, feel connection and belonging, and are satisfied with the quality and amount of connection they get with others.

Social connection is so important to mental, physical and cognitive health that the US Surgeon General has launched a policy ‘call to action’ and the UK and Japan have government ministers responsible for countering loneliness.

Australian policy responses like social prescribing, recently introduced by the Victorian Government, are designed to combat social anxiety and lack of knowledge about how to connect; however, less attention is given to evidence that there are places that can help people connect by making it easier to simply ‘bump’ into others.

BUMPING SPACES

‘Bumping spaces’ help people meet – by accident! You don’t have to go through the work and anxiety of strategising how to meet new friends. These are places where people literally bump into each other – like when you’re waiting in the corridor for your yoga class, queuing to ask a question at the library, or attending a craft group at your local neighbourhood house.

Bumping spaces can also be private businesses, like cafes or corner shops.

Importantly, these places build community by being local and close to home, so you often see the same faces, and eventually come to say hello, and then strike up a conversation.

By helping to build community, these places build social capital and social cohesion, vital neighbourhood assets for economic prosperity and community resilience.

By offering places that are welcoming and ‘neutral’, community-building infrastructure like libraries and neighbourhood houses are accessible and attractive to a diversity of people.

As political scientist Daniel Aldrich puts it, these places nurture “the ties that are hardest to find in our relationships precisely because they connect us to people different from us”.

Libraries aren’t just for books, with many providing novel and eclectic programs, activities and services designed to meet users’ needs. For example, Merri Bek Council has a social worker in the library program and many libraries run community health programs.

Neighbourhood houses and other community centres are lifelines for many people, promoting social cohesion and combating loneliness.

HOW LOCAL IS YOUR LOCAL COMMUNITY HUB?

Our Map of the Month looks at the accessibility of vital ‘community-building’ social infrastructure to Melbourne’s residents – those special neutral places where diverse people can meet by chance – libraries, neighbourhood houses and community centres.

What immediately springs out from the map is the high concentration of community-building spaces in established suburbs, mostly close to the city centre, with apparently fewer in the outer, newer suburbs.

This raises alarm bells.

Melbourne’s outer metropolitan suburbs are some of the fastest growing in Australia and include highly diverse populations that are also affected by financial stress and where residents often have long commute times, with less access to local employment.

These people need to be able to readily access infrastructure to help them literally build new communities.

Looking at the map, the sparse and dotted picture outside the more established inner suburbs suggests that libraries, community centres and neighbourhood houses at the periphery are all serving large areas.

How can people ‘bump’ into their neighbours if they are travelling long distances to attend a class or use the library?

In contrast, the map shows that those living in the inner suburbs can more easily access a range of community-building infrastructure and these places are likely made even more accessible through the increased availability of inner-city public transport.

GROWTH AREAS NEED BUMPING SPACES

The mapped data highlights disparities between established areas and growth areas that are likely occurring internationally. However, these disparities may be particularly significant for Melbourne which is growing rapidly, becoming home to people from areas across the globe.

This means Melbourne suburbs must work hard to grow community belonging, cohesion and multicultural understanding.

Our recent study found that diverse residents of Melbourne’s outer metro reported three main barriers to social connection: having few opportunities to work locally; difficulties and anxiety from being misunderstood due to language or culture; and challenges in finding like-minded people.

Some new residents said they had met other locals at the library or skatepark, through local employment or volunteering, or being invited to join a group by a neighbour or community development worker.

However, people who worked found it hard to access activities near home as places might be closed or feel unsafe during the evenings.

We’ve heard of food deserts without access to shops that sell healthy food, but maybe we should also be talking about ‘social connection deserts’, where people are isolated through lack of access to vital social provisions.

One of the problems we have as social connection researchers is a lack of good data. Knowing where the community-building spaces are is difficult enough, but we also want to know what social connection happens there.

This is an international problem, and we have an opportunity in Melbourne to be pioneers at generating good quality social connection data through a collaboration of researchers, government and community organisations.

Meanwhile, there is something we can all do – get out and use our local community-building spaces.

This is important. By joining a class, going to a talk or event, or even just borrowing a book, you will be supporting these vital places – they will increase their services, open longer hours and maybe new centres will be built closer to where you live.

You’ll get lots of personal benefits, too – who knows, you might even make a new friend or two.

Map of the Month is a science communication project of the University of Melbourne (Melbourne Centre for Cities, AURIN, Melbourne Data Analytics Platform and Pursuit) using maps to spark important policy conversations across metropolitan Melbourne. This pilot is supported by the Lord Mayor’s Charitable Foundation and in partnership with the Victorian Office for Suburban Development and the Municipal Association of Victoria. Academics, community leaders and government representatives from across Melbourne contribute to the maps and accompanying stories.

This month’s map was produced by Amanda Belton, Dr Emily Fitzgerald and Flavia Barar.

This article was originally published on The Pursuit. Read it here.

As New Zealand CBDs evolve post-pandemic, repurposing old or empty spaces should be on the drawing board

By Jose Antonio Lara-Hernandez - Senior Researcher in Architecture, Auckland University of Technology

J. Antonio Lara-Hernandez is an architect and urban researcher with more than 15 years of experience. He was a distinguished member of the curatorial team of the Italian Pavilion at the Venice Biennale 2021. His research and professional experience include works in Mexico, Italy, Switzerland, New Zealand, and the United Kingdom. He focuses on research topics related to informality in the urban landscape, as well as studies on urban resilience and architectural exaptation. Antonio is a prolific academic scientist focused on the impact of the transformation of the built environment at the streetscape level towards the diversity and inclusion city centres.

The COVID-19 pandemic and the hybrid work patterns it fostered have changed the way we think about office space, and central business districts in general. While fears of urban centre “ghost towns” may have been premature, many cities around the world still face dilemmas over how best to adapt.

New Zealand is feeling this pressure too. Office vacancy rates, while dropping slightly, have remained above 12%. At the same time, there is demand for high-quality, modern spaces that fit new work and collaboration models.

This isn’t an entirely new phenomenon. Throughout history, cities and buildings have been designed with specific functions in mind. As environmental and social needs change, however, these designs struggle to meet contemporary demands.

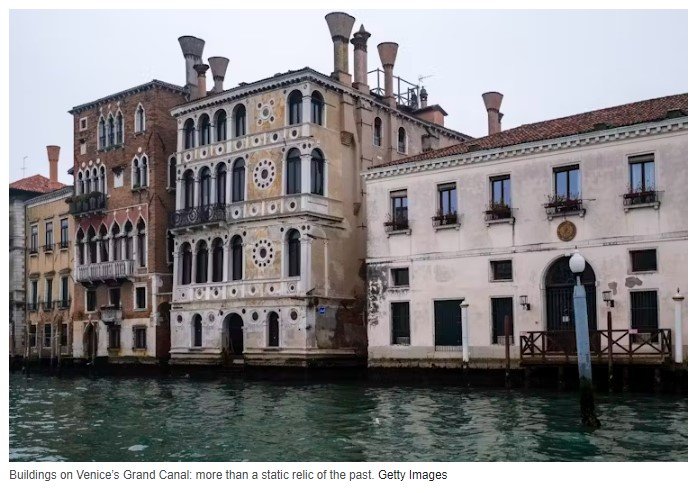
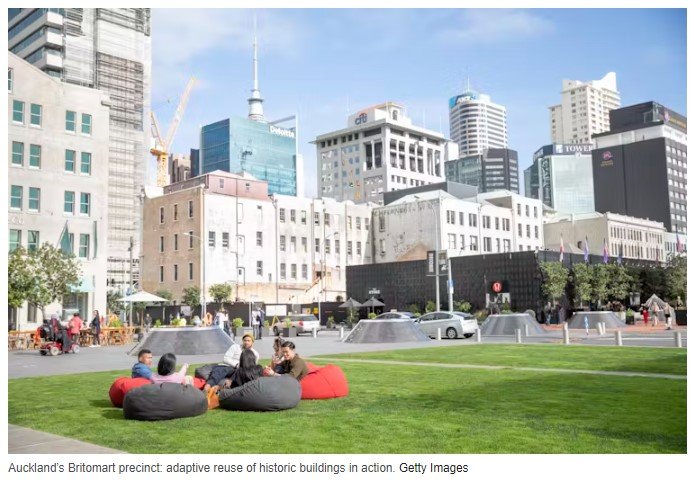
So, what can be done with the empty buildings and unleased floors scattered through cities everywhere? In our new book, Architectural Exaptation: When Function Follows Form, we examine the process by which existing structures or features are re-imagined and re-utilised.

In architecture, the concept of “exaptation” refers to this adapting of buildings and structures for new uses. It is becoming increasingly relevant as a transformative response to sustainable and resilient urban development.

The benefits of adapting

Exaptation in architecture requires us to view built environments not just as physical spaces, but as complex living systems that can adapt and transform.

Reusing and repurposing existing structures also helps reduce waste, CO₂ emissions and energy use, supporting more sustainable urban growth. At the same time, by reusing rather than rebuilding, the historical and cultural fabric of cities is preserved, as well as their inhabitants’ sense of identity.

A famous example is Venice, which has continuously adapted its historic structures to meet modern needs, while maintaining their unique character.

Sometimes seen as a static relic of the past, Venice is in fact a dynamic example of how urban spaces can evolve. The city’s ability to repurpose spaces and structures – turning palazzos into museums or residential buildings into boutique hotels – demonstrates architectural exaptation in practice.

The Highline in New York provides another good example. Rather than demolish an old elevated railway, it was repurposed as a pedestrian walkway, becoming a now iconic public space.

The social life of cities

The notion and application of architectural exaptation also has profound implications for the way we approach urban planning and development. In particular, it challenges the linear thinking and conventional growth models behind building new structures.

Encouraging the creative reuse of existing structures not only reduces resource use, it also embeds a layer of history and culture that enriches the urban experience.

The concept goes beyond the physical to encompass the social and cultural dimensions of city life. By fostering built environments that adapt to the needs of their communities, cities can become more inclusive and responsive to their inhabitants’ needs.

This also aligns with the idea of the “15-minute city”, which aims to fulfil the daily needs of residents within a short walk or bike ride – not unlike a medieval city or town, in that sense.

A paradigm shift

There are economic and logistical challenges with implementation, of course, including structural capacity. Some older buildings may require upgrades to meet required standards for their intended new function.

Building codes and regulations in some places are complex, which may not always align with the intended reuse. Moreover, depending on the infrastructure requirements of the new building’s use – power, plumbing, heating and ventilation systems – upgrades and compatibility work can be needed.

In some heritage buildings, the sensitivity of the architect in balancing preservation and modernisation becomes a key factor. And sometimes it is simply cheaper to build from scratch than to adapt.

But the main challenge is deeper still: encouraging a paradigm shift away from a conventional development model towards a more sustainable one.

To achieve that, building codes and regulations will need adjusting to be more flexible. Economic stimulus packages and financial and tax incentives will underpin any real shift to a new approach.

From Venice to Auckland

A city need not be as ancient and unique as Venice for this to work. Take Auckland, for example, where architectural exaptation could be applied to transform its moribund centre from a “dormitory” CBD into a vibrant and lively precinct.

Auckland’s remaining historic buildings have the potential for adaptive reuse and the incorporation of arts and culture into everyday spaces. This would foster a more dynamic environment, even after business hours. The Britomart precinct is a good example of this already happening.

More than that, given the challenges presented by climate change, architectural exaptation provides a blueprint for making cities more resilient, sustainable and flexible. This goes beyond architectural theory and is a call to action. It urges architects, planners and city dwellers to rethink the role of the built environment.

By learning from the adaptive strategies of the past, we can forge a future where our cities are not only sustainable, but also vibrant and culturally rich centres of human life.

This article was originally published on The Conversation. Read it here.

These maps tell us we need to cool our sweltering streets

Our Map of the Month shows the impact of asphalt and concrete on city temperatures, and why we need to ‘de-pave’ and ‘re-plant’ in a warming climate

By Dr Thami Croeser, RMIT University, and Professor Michele Acuto, University of Melbourne

We’ve just lived through the world’s hottest year on record, as well as the hottest decade on record.

And yet, we keep building our cities out of materials that get incredibly hot during heatwaves – which also stay hot well into the night. For example, unshaded asphalt can reach temperatures of 75°C during a heatwave.

This is why cities experience the ‘urban heat island effect’ – a striking phenomenon which makes cities 4-10 degrees hotter than the countryside.

During a succession of recent heatwaves in Perth, the city experienced seven days above 40°C in February alone. At these temperatures, heat-related illnesses weigh on the economy and can be a deadly threat to vulnerable communities.

Energy demand goes through the roof, often crashing the grid and causing blackouts, while our streets become desolate.

So, what can cities do about heatwaves, and the urban heat island effect?

There’s lots of excellent research that tells us that a crucial part of the response is planting trees – and a lot of them. A recent study found that more than 40 per cent canopy cover is required just to negate the heating effects of asphalt and concrete.

If planting trees is like installing natural air-conditioning, then laying asphalt is like doing star jumps while wearing a thick woolly jumper.

Currently the world is doing both.

We’re planting trees and building whole new suburbs with vast expanses of unshaded asphalt, plus black, heat-absorbing roofs on our houses. The development of apartment buildings follows a similar pattern: inner city areas might be becoming more pedestrian friendly and ‘buzzy’, but our streets are mostly car-oriented, which means we keep all the asphalt and concrete.

With tree planting efforts barely keeping pace with tree losses, we’re going to want to not only up our urban forestry budgets, but also look at the other side of the equation: all that asphalt.

Our latest Map of the Month focuses on this issue. Using detailed data from Geoscape Australia, for every building in Metropolitan Melbourne, we’ve calculated the area around each structure that is made of asphalt and concrete.

We’ve the assigned a colour to each building to indicate whether it’s getting natural air-conditioning or wearing that metaphorical woolly jumper.

If your house is mostly surrounded by asphalt and concrete, it’ll show up as dark red. At the other end of the scale, if you’re lucky enough to be surrounded by trees and vegetation, you’ll see a lot of blue in your neighbourhood.

We also mapped neutral materials (grass and bare soil) and factored these into our scoring. Because we are looking at the impact of different kinds of open space around buildings, we haven’t included the heat impact of the buildings themselves, which can also add to the urban heat island effect.

The results are striking.

In total, we have surrounded our homes and workplaces with 271 square kilometres of asphalt and concrete, an area the size of central Paris and central Brussels put together.

More than half of all the buildings in Melbourne – over 1.5 million structures – are surrounded with land that’s at least a third concrete and asphalt.

The distribution of these ‘sweltering streets’ is very uneven too. New suburbs on the fringe and high-density inner neighbourhoods cop a lot of heavy asphalt cover just waiting to soak up heat.

Check out the difference between the post-industrial neighbourhoods of Abbotsford and Richmond in the City of Yarra – which took on over 5,000 new residents in 2023 – and the adjoining established low-rise residential areas with leafy lushness in Kew and Hawthorn.

There’s also a stark east-west divide, with Melbourne’s wealthy leafy suburbs enjoying much better protection than our hotter – and more socioeconomically disadvantaged – suburbs in the west.

From the established suburbs of Hobson’s bay to the western fringe at Werribee, and all the way north to Craigieburn, is a sea of red. That’s a lot of heat exposure, carried by a lot of people in lower-income, less flexible (and often outdoor) employment, with less ability to pay for air conditioning.

Fortunately, our rolling plains of hot asphalt don’t have to be permanent.

A global movement to ‘de-pave’ cities highlights the many ways that streets can be retrofitted to make space for green cover – often by taking a little space back from cars.

This ranges from small projects to remove parking spaces to widening footpaths and closing lanes to create urban parks.

Recent projects have shown how cities can narrow wide-splayed intersections to both discourage speeding and add new green space.

With millions of square metres of asphalt surrounding the places we live and work, we certainly have our work cut out for us, and de-paving is still a fairly marginal activity in most cities.

As cities like Paris, London and Barcelona lead the way in boldly re-balancing their relationship with the automobile, we see huge potential to turn Melbourne’s asphalt into thriving urban nature.

We want to see some of those red patches on our Map of the Month turn dark blue.

Map of the Month is a science communication project of the University of Melbourne (Melbourne Centre for Cities, AURIN, Melbourne Data Analytics Platform and Pursuit) using maps to spark important policy conversations across metropolitan Melbourne. This pilot is supported by the Lord Mayor’s Charitable Foundation and in partnership with the Victorian Office for Suburban Development and the Municipal Association of Victoria. Academics, community leaders and government representatives from across Melbourne contribute to the maps and accompanying stories.

This month’s story was a collaboration between RMIT’s Centre for Urban Research and the Melbourne Centre for Cities, and the map was produced by Dr Emily Fitzgerald, Amanda Belton and Dr Stuart Lee, using data kindly provided by AURIN and Geoscape Australia.

This article was originally published on The Pursuit. Read it here.

City planners love infill development. So why are cities struggling with it, and how can they do better?

Forestville, Adelaide. Renewal SA, CC BY

By Neil G Sipe - Honorary Professor of Planning, The University of Queensland

Infill development is an increasingly hot topic in Australian cities. It involves building on unused or underutilised land within existing urban areas.

City planners see infill development as essential. It’s a way to end urban sprawl and improve service delivery to a growing population at lower cost. Infill development has increased in popularity over several decades because it uses existing physical and social infrastructure, is close to amenities and enhances local economies.

Governments and planners have set infill development targets. However, these targets are not being met. Greenfield projects on undeveloped land continue to outpace infill development.

Perth, for example, has an infill target of 47%. The rate of higher-density infill actually fell recently to 29% of all new development.

However, most states and territories already have the means to deliver more infill development, in the form of land development authorities.

What are the obstacles?

Infill targets aren’t being met for various reasons. These include:

  • opposition from some (but not all) local residents, because of increased noise and traffic disruptions

  • difficulty in assembling enough land to make the project feasibile

  • higher development costs due to land prices and higher densities

  • stronger market demand for greenfield housing

  • need to upgrade infrastructure for infill locations

  • complex and time-consuming planning approvals.

Greenfield development is popular with developers and consumers because it costs less up-front. However, such development may cost society more. These added costs include transport – both public transport and roads – as well as social, health and other government support services.

Ad-hoc, small-scale infill that typically covers only a few lots is happening. Unfortunately, these projects are not enough to achieve infill targets.

And they are creating other problems. They often convert backyards into housing. This reduces open space and adds to urban heat island impacts.

What have governments done about it?

Governments have worked on increasing infill development for decades. One of the earliest attempts involved land development authorities. The idea originated with the Whitlam government in the early 1970s.

The Commonwealth Department of Urban and Regional Development encouraged states to establish these authorities in response to the “shortages of residential land and the accompanying rapid price rises that occurred in Sydney, as in the other major cities in Australia in the late 1960s and early 1970s”. Their purpose was “to acquire land for present and future urban development and other public uses to help moderate the housing market, stabilise land supply and support the development industry with homesite sales to be made at the lowest practicable price”.

Many states and territories have land development authorities or their equivalents. These bodies have undertaken a significant number of projects, but it’s small when considering population growth.

For example, LandCom in NSW has been involved with 220 projects and provided housing for 100,000 since it was set up. Sydney’s population has grown by more than 2 million people in this time.

As well as NSW’s Landcom, other authorities of this kind include Development Victoria, Renewal SA, DevelopmentWA and the Australian Capital Territory’s Suburban Land Agency. Queensland had the Urban Land Development Authority, which became part of Economic Development Queensland. (The above links include lists of projects.)

We need to build on this work

While land development authorities have been around for almost 50 years they have not been as successful as hoped. One reason is that they have not focused solely on infill development. They also have tended to use land already owned by the government.

There are other issues too. Population growth has outpaced the authorities’ capacity to deliver housing. There are political sensitivities about the government taking away development opportunities from the private sector.

One reason for Australia’s housing problem is the length of time it takes to get a project approved. This is particularly true for infill development.

One attempt to overcome this obstacle was Queensland’s Priority Development Areas (PDAs), which took effect in 2012. According to Economic Development Queensland, “when a PDA is declared, Economic Development Queensland works closely with local government and other stakeholders to plan, assess and guide development within a PDA. This includes the preparation of a development scheme.” Many PDAs are urban infill projects.

Another Queensland initiative announced last February is the A$350 million Incentivising Infill Fund. Its focus is to provide relief from infrastructure charges for “market-ready” private infill developments.

Governments at all levels are looking for ways to make more housing available and affordable. Infill development is a viable option, but it can be improved by making more use of mechanisms like land development authorities. They can provide co-ordinated planning and development at a scale that will improve our cities.

So, rather than looking for new solutions, we should make better use of existing ones that have proven effective.

This article was originally published on The Conversation. Read it here.

Predictions for 2024 Capital Markets investment volumes in Australia

Predictions for interest rate cuts in the next two years will support an increase to local investment volumes. Here’s what experts think investors should keep an eye on in the year ahead. - CBRE

“Cautious optimism as opposed to the blind optimism we saw early last year.” 

That’s the sentiment on the ground right now regarding Capital Markets investment volumes across Australia in 2024. It’s an observation which comes via Flint Davidson, CBRE’s Pacific Head of Capital Markets. 

“We were hoping this time last year that market stability would return with investment demand. However, Australia had to re-price and this is taking some time,” he explains. 

“This year the fundamentals are much more supportive of recovery, particularly as it relates to the normalisation of monetary policy. Pricing has reverted across all sectors in the past 12 months, some by as much as 30 to 40 percent. After a very disjointed past few years, it feels like there is intent to make things happen as we move through 2024.” 

It’s a landscape similarly depicted by CBRE’s latest Pacific Market Outlook 2024 report which indicates relatively flat investment volumes this year before an expected resurgence in 2025. This forecast comes from CBRE’s prediction of two 25bps rate cuts from mid-2024, followed by two more 25bps cuts in the first half of next year. The expected result will be a 3 percent increase in Australian investment volumes in 2024 to circa $20 billion, followed by a 37 percent increase to $28 billion in 2025 aided by a rebound in office sales. 

To delve deeper into these findings on Capital Markets investments, we also spoke to Tom Broderick, Head of Office & Capital Markets Research, Australia, to explain what it all means. Together, the pair will paint a clearer picture of what investors in this space should keep an eye on in the year ahead. 

Industrial and retail: Australia’s expected growth sectors 

CBRE research found that growth sectors such as industrial and retail were set to be early beneficiaries of Australia’s improving transaction volumes.  

“Major institutional investors are typically more focused on gateway cities around the world,” says Broderick. “This means Sydney and Melbourne are likely to benefit more. However, markets like Brisbane and Perth are also benefiting from strong population growth, which is a driver for both industrial demand and retail spend. 

“Industrial & Logistics is seen as the one of the safest sectors given the strong fundamentals such as e-commerce penetration as well as a lack of new supply across many markets. This sentiment will remain as long as rents are able to be maintained and the leasing market is stable.” 

Office sector resurgence 

With trough to peak expansion of cap rates forecast to be 150bps to 200bps for prime office, there’s a need to understand what’s strengthening the post-pandemic office sector and whether it’s sustainable long term. 

“Given the decline in office values, some investors are starting to return to the asset class,” says Broderick. “The pricing is starting to look attractive again while cities like Brisbane, Perth and Sydney are starting to observe solid rental growth, implying the weakened post-COVID leasing market is recovering.” 

When it comes to premium office assets, Davidson is similarly optimistic based on his market observations. 

“Premium office is a finite commodity. It’s very hard to produce more product, particularly at present and in most years of the cycle owners generally aren’t sellers. 

“The window to buy the best quality assets is open now as some REITS and wholesale funds remain motivated to achieve liquidity and developers are seeking funding solutions. While the discounts available are significant they won’t be to the same extent as secondary assets, but it will be the ability to access the best buildings that will motivate the capital. 

“Those looking to get set later in the year or early next will probably miss the window.” 

Student accommodation vs build-to-rent 

This year’s Pacific report highlighted that student accommodation and build-to-rent assets would be less prone to outward cap rate movement than other real estate asset classes. What’s the perspective from the experts on why Living Sectors are proving more resilient to the higher interest rate environment?   

“Both sectors in Australia are still lacking scale and are in their relative infancy compared to other parts of the globe,” says Davidson. “Student accommodation has very strong tailwinds due to the proven demand and operating expenses, undersupply across the major cities and higher returns which are attracting capital. International student numbers in Australia are back to pre-pandemic levels which is putting additional pressure on inner city residential vacancy rates. Student accommodation also has a more favourable MIT tax treatment which is a frustration of owners in build-to-rent.  

The huge influx of international students, which is a key driver for Australia’s overall population growth, could also be a key driver adds Broderick. “However, we are seeing more significant rental growth in the Inner City apartment markets which has trended at 15 percent-plus in some instances during 2023. The structural undersupply of rental accommodation in Australia is well understood by global capital and we are receiving substantial levels of inbound enquiries on how to access the market from Asian investors in particular. When the tax settings are reset for build-to-rent, we anticipate a greater flow of investment into the sector, which is likely to focus initially on the Eastern Seaboard and will then diversify into the other state capitals.” 

Potential investment volume challenges 

While there is significant upside to CBRE's forecasts if interest rate market movements are favourable in the coming years, it’s equally important to be aware of any potential challenges to Capital Markets investment volumes. 

“The bounce in investment volumes will be inextricably linked to the return of normalised monetary policy,” says Davidson. 

“Any delay in interest rate cuts due to inflation proving stubborn is likely to keep volumes subdued, albeit above what we saw in 2023. The extended timeframe required to close transactions will mean transaction volumes will still lag for the first half of this year, however this shouldn’t be interpreted as a continuation of a subdued market. 

“We expect the first movers to be busily setting themselves and taking advantage of a rare phase in the cycle for capital to take advantage of sellers' acceptance of re-set market pricing and a limited number of conviction buyers.” 

Broderick believes that the risk is more weighted to the upside rather than the downside for investment volumes. 

“Recent data releases on jobs, retail sales and inflation have been more pessimistic than consensus views, indicating that the RBA might have to start cutting rates to maintain a stable economy. This will help investor sentiment for commercial property. 

“It generally takes a few years for investment volumes to return to previous peaks. This was the case following the Global Financial Crisis. Investors need to be confident that pricing has largely stabilised before we start to observe growth in volumes.” 

Despite any potential headwinds, investors should find some confidence in Australia’s robust investment climate. CBRE’s Pacific Market Outlook reveals that Australia is currently ranked third across APAC for countries where buyers are targeting cross border investment. The reason? 

“Australia is seen as a safe investment destination by offshore investors given its transparency, strong legal system and fundamentals such as population growth,” says Broderick.  

This was originally published on the CBRE website. Read more here.

Stamp duty is holding us back from moving homes – we’ve worked out how much

By Nick Garvin - Adjunct Fellow, Department of Economics, Macquarie University

If just one state of Australia, New South Wales, scrapped its stamp duty on real-estate transactions, about 100,000 more Australians would move homes each year, according to our best estimates.

Stamp duty is an unquestioned part of buying a home in Australia – you put your details in an online mortgage calculator, and stamp duty is automatically deducted from the amount you have to contribute.

It’s easy to overlook how much more affordable a home would be without it.

That means it’s also easy to overlook how much more Australians would buy and move if stamp duty wasn’t there.

The 2010 Henry Tax Review found stamp duty was inequitable. It taxes most the people who most need to or want to move.

The review reported:

Ideally, there would be no role for any stamp duties, including conveyancing stamp duties, in a modern Australian tax system. Recognising the revenue needs of the States, the removal of stamp duty should be achieved through a switch to more efficient taxes, such as those levied on broad consumption or land bases.

But does stamp duty actually stop anyone moving? It’s a claim more often made than assessed, which is what our team at the e61 Institute set out to do.

We used real-estate transaction data and a natural experiment.

What happened when Queensland hiked stamp duty

In 2011, Queensland hiked stamp duty for most buyers by removing some concessions for owner-occupiers at short notice.

For owner-occupiers it increased stamp duty by about one percentage point, lifting the average rate from 1.26% of the purchase price to 2.27%.

What we found gives us the best estimate to date of what stamp duty does to home purchases.

All over Australia, stamp duties suppress movement. Sam Mooy/AAP

A one percentage point increase in stamp duty causes the number of home purchases to decline by 7.2%.

The number of moves (changes of address) falls by about as much.

The effect appears to be indiscriminate. Purchases of houses fell about as much as purchases of apartments, and purchases in cities fell about as much as purchases in regions.

Moves between suburbs and moves interstate dropped by similar rates.

With NSW stamp duty currently averaging about 3.5% of the purchase price, our estimates suggest there would be about 25% more purchases and moves by home owners if it were scrapped completely. That’s 100,000 moves.

Victoria’s higher rate of stamp duty, about 4.2%, means if it was scrapped there would be about 30% more purchases. That’s another 90,000 moves.

Even low headline rates have big effects

The big effect from small-looking headline rates ought not to be surprising.

When someone buys a home, they typically front up much less cash than the purchase price. While stamp duty seems low as a percentage of the purchase price, it is high as a percentage of the cash the buyer needs to find.

Here’s an example. If stamp duty is 4% of the purchase price, and a purchaser pays $800,000 for a property with a mortgage deposit of $160,000, the $32,000 stamp duty adds 20%, not 4%, to what’s needed.

If the deposit takes five years to save, stamp duty makes it six.

A similar thing happens when an owner-occupier changes address. If the buyer sells a fully owned home for $700,000 and buys a new home for $800,000, the upgrade ought to cost them $100,000. A 4% stamp duty lifts that to $132,000.

Averaged across all Australian cities, stamp duty costs about five months of after-tax earnings. In Sydney and Melbourne, it’s six.

Stamp duty has bracket creep

This cost has steadily climbed from around six weeks of total earnings in the 1990s. It has happened because home prices have climbed faster than incomes and because stamp duty has brackets, meaning more buyers have been pushed into higher ones.

Replacing the stamp duty revenue that states have come to rely on would not be easy, but a switch would almost certainly help the economy function better.

The more that people are able to move, the more they will move to jobs to which they are better suited, boosting productivity.

The more that people downsize when they want to, the more housing will be made available for others.

Our findings suggest the costs are far from trivial, making a switch away from stamp duty worthwhile, even if it is disruptive and takes time.

This was originally published on The Conversation. Read it here.

Prefabricated and build-to-rent houses could help bring rents down

By Ameeta Jan, Associate Professor, Deakin Business School, Deakin University

Australia’s rental vacancy rate has hit a historic low of close to zero. The latest estimate from SQM Research is 1.1%. The latest estimate from the property listing firm Domain is 0.7%.

As would be expected with hardly any of Australia’s rental properties vacant and available for rent, rents have soared – at first in 2022 only for newly advertised properties, and later for properties in general as measured by average rents.

The Bureau of Statistics measure of average capital city rents climbed 7.3% throughout 2023. It would have climbed by more – by 8.5% – had the bureau not taken account of the increased rent assistance in the May budget, which depressed recorded rents by 1.2%.

Demand surged while new supply sank

Vacancy rates have fallen and rents have climbed because the demand for living space has surged; at first in the aftermath of lockdowns as Australians sought accommodation with fewer housemates and more home office space, and later as borders reopened and Australia’s population swelled.

At the same time, the number of dwellings completed dived in response to shortages of both labour and materials.

Before COVID about 50,000 new dwellings were completed per quarter. Since then, completions have rarely exceeded 45,000.

Tweaking tax concessions would do little to help

While the Australian Greens are pressing the government to wind back capital gains tax concessions and limit negative gearing in order to wind back home prices, there’s little reason to think the changes would do much to reduce rents.

Half of all Australian landlords negatively gear by making a net loss on rental income in order to profit later from concessionally taxed capital gains. Attacking these tax concessions would be likely to cause some of them to reconsider being landlords.

But if they sold, more renters would be able to buy and stop renting, leaving the balance of renters and properties for rent little changed.

Rent assistance and caps won’t much help either

While there is popular support for increasing rent assistance, and while it has materially cut rents paid over the past year, it won’t create more rental properties.

Very big increases in rent assistance might even lift rents further by increasing the amount renters are able to pay. However, the effect is unlikely to be big because Commonwealth rent assistance is restricted to welfare recipients.

Rent caps or freezes don’t increase supply either, and run the risk of encouraging a black market in bidding to pay rents over the legally sanctioned cap.

What’s needed is more homes, in the right places

The government’s new Housing Australia Future Fund and associated agreements are intended to support the delivery of 20,000 new social and 20,000 new affordable homes over the next five years.

Separately, the Commonwealth and the states have agreed to an ambitious target of 1.2 million “new well-located homes” over the next five years, up from 918,200 over the past five years.

The Commonwealth has set aside A$3 billion for “performance-based funding” to the states paid at the rate of $15,000 for each new well-located home they deliver in excess of their share of 1 million new homes in five years.

If the states and territories are able to deliver 1.2 million homes over five years rather than 1 million, Grattan Institute analysis suggests rents will be 4% lower than they would have been.

NSW is displaying the sort of initiative that will be needed. The state is allowing developers of projects worth more than A$75 million to build taller buildings with more accommodation as long as they use 15% of the floor space for affordable housing.

NSW is also allowing denser development within 400 metres of 31 train stations.

Build-to-rent would help

In Australia, most rental properties (even apartments) are owned by individual so-called “mum and dad” investors.

Overseas in the United States and Europe, they are more likely to be owned by corporations who build entire blocks to lease.

These corporations are more concerned about long-term returns than individual owners who want the flexibility to sell, so they tend to offer long-term leases on better terms.

In last year’s budget the government offered build-to-rent tax rules which the Property Council of Australia says could create thousands of extra homes.

On one hand, they are unlikely to be homes for low-income renters. Developers require commercial returns. On the other hand, an increasing number of renters have high incomes.

The Australian Housing and Urban Research Institute says while in 1996 households with incomes worth $140,000 a year or more in today’s dollars accounted for only 8% of renters, by 2021 they accounted for 24%.

Pre-fabs could also help, and more apprentices

Another thing that would help is encouraging the use of prefabrication to cut construction times and costs, using locally sourced materials.

Prefabricated homes were used to house migrants after the second world war. More recently they have been used to house NSW flood victims.

They will still require skilled builders and tradespeople, who are in short supply. Only about half of enrolled apprentices complete their training, and the dropout rate has been climbing.

The government has announced an in-depth review of Australia’s system of apprenticeship support. It’s due to report later this year.

It might also help to prioritise the migration of tradespeople. It’s hard to build more homes in the right places, but that’s what we need.

This article was originally published on The Conversation. Read it here.

Can real estate transition funds get older buildings up to scratch?

Retrofitting momentum is increasing but there’s a long road ahead for brown-to-green building transitions

Nidhi Baiswar - Senior Director, Global Sustainability and Climate Leadership

More real estate transition funds are emerging around the world, aiming to transform an abundance of older, energy inefficient buildings into sustainable spaces.

Several major fund managers, including France’s Ardian and Swiss-based Empira Group, have raised, or are currently raising capital. Their focus is on retrofitting and refurbishing commercial and residential real estate as the race to decarbonize buildings, which account for 40% of global carbon emissions, accelerates.

“There’s clearly growing investor appetite for real estate transition strategies as they recognize the financial, environmental and social benefits in making buildings more sustainable,” says Nidhi Baiswar, Senior Director, Global Sustainability and Climate Leadership at JLL. “These transition funds are successfully raising capital but it’s early days as we wait to see exactly how and where capital, which is mainly value-add and opportunistic, is deployed.”

Many markets around the world are currently struggling with an imbalance between supply of, and demand for, sustainable buildings. Tenants, largely driven by their own ambitious carbon reduction goals, want spaces that support their progress and demonstrate proof of commitment to employees, shareholders and customers.

Investors are increasingly taking note. According to JLL’s 2024 UK Capital Markets Outlook, 50% of investors said occupier requirements are one of the biggest ESG drivers behind decisions to buy or bid on an asset.

Yet JLL research across 20 major global office markets also shows that only 34% of future demand for low carbon workspace will be met in the next several years.

For buildings that do currently meet the grade on sustainability credentials, JLL calculates that green premiums on rents currently range from around 7% in US cities, to just under 10% in APAC and over 11% in London. 

Looking beyond prime

While much tenant demand is focused on large spaces in prime locations, much of the action within the growing transition funds market is, for now, eyeing smaller properties in well-connected urban areas. Non-core assets offer an opportunity to demonstrate early successes to investors before scaling up to consider larger, more ambitious projects, Baiswar says.

High vacancy is creating a “blank canvas” for redevelopment of offices, currently the sector going through the most upheaval. But other sectors also offer transition opportunities.

“Office vacancy has of course created an opening for developers – it’s a pretty unique moment in that sense. But we’re seeing transition opportunities across the board, from industrial properties, where there are often helpful long-term owner/tenant relationships in place, to retail parks and multi-let residential,” says Baiswar.

“And some of the transition funds out there right now are highly sector agnostic – broadening their investment horizons to multiple sectors, like proptech and infrastructure alongside real estate.”

Stumbling blocks

But transition, or so-called brown-to-green funds, face stumbling blocks, including finding green building expertise and skills, as well as the right development partners.

“Matching the capital with refurbishment knowledge is a challenge,” says Baiswar. “Opportunities to invest are numerous but finding development partners with a track record is key. It’s why for some, joint ventures are a credible route.”

Australian fund manager Investa last year teamed up with developer Built to form a joint venture aimed at upgrading obsolete offices in both Sydney and Melbourne’s central business districts.

At the same time, inconsistencies in companies’ disclosure and reporting data are adding another layer of complexity.

“Many investors are global in their modus operandi,” explains Baiswar. “That means dealing with an alphabet soup of regulations in multiple jurisdictions. More clarity in Europe, for example, on disclosures for investors will hopefully ease complexity this year.”

Real estate funds body, INREV, has called for new labelling by the EU to replace sustainable finance disclosure regulation (SFDR) articles 8 and 9 sub-categories that are currently in place. Article 8 refers to ‘light green’ funds that promote environmental or social characteristics while article 9 ‘dark green’ describes funds that target sustainable investment.

Data from New Private Markets shows only eight private real estate funds classed as SFDR article 9 have reached a final close since 2018, raising $3.1 billion. In comparison, 34 article 8 real estate funds have closed, raising $25.3 billion.

In London, U.S. manager Fidelity’s article 9 fund has taken on its first project refurbishing a City district building to create more sustainable office space.

“Regulations can help further the performance of transition funds. The better a fund can disclose against compliance with a set of regulations, the more it can promote itself in the market and attract investors,” says Baiswar.

Retrofit urgency

With 80% of today’s office buildings likely to still be in use in 2050, the role that transition funds can play on the road to net zero cannot be understated, says Baiswar.

And retrofitting will require significant investment. JLL’s research Retrofitting to be Future-Fit estimates the cost of retrofitting the office and shopping mall stock across 17 major countries to be close to US$3 trillion.

With many landlords unable or unwilling to spend the sums required to get their buildings up to scratch in time to comply with increasingly stringent regulation, transition funds can fill the gap.

And right now, the tenant demand for sustainable space only strengthens the business case, says Baiswar. “Now and in the next few years there’s a big opportunity to upgrade existing assets to a certain level of performance – while crucially, over time, creating value for the building owners and tenants, and sizeable returns for investors.”

This article was originally published by JLL. Read it here.

Let’s not kid ourselves that private investors or super funds will build the social housing we need

Authors: Brendan Coates Program Director, Economic Policy, Grattan Institute and Joey Moloney Deputy Program Director, Economic Policy, Grattan Institute

Treasurer Jim Chalmers is leading a push to get private investors to help build more social and affordable housing. But we shouldn’t kid ourselves about where the money will come from.

The defining feature of social and affordable housing is a big rental subsidy for the tenant, which no private investor will ever volunteer to pay. In the end, government – that is, taxpayers – will always foot the bill.

The sooner we accept this, the better. Wishful thinking that private investors will wear the cost of rental discounts risks making the limited government subsidies available for housing less effective.

We need more social housing

Social housing – where rents are typically capped at 30% of tenants’ incomes – makes a big difference to the lives of many vulnerable Australians.

Yet Australia’s stock of social housing – currently about 430,000 dwellings – has barely grown in 20 years, during which time the population has increased by 33%.

A stagnant stock means there is little “flow” of available housing to catch people going through hardship, who then face prolonged, agonising waits while struggling to afford to keep a roof over their head.

But it’s expensive

The main reason our social housing stock has stagnated is the expense.

Social housing offers a big rental discount, or subsidy, to tenants.

In Australia, the gap between the subsidised rent and the private market rent is about $15,000 per rental per year.

Because the subsidy to tenants is ongoing, the cost to governments is ongoing. That means that every extra 100,000 social housing dwellings costs an extra $1.5 billion every year.

The same goes for subsidised “affordable” housing, where rents are typically set at 20-25% below the market rate, and which are available to many low- and some middle-income earners.

If the tenant is getting a discount on the market rate, the government will pay for that somewhere along the line.

Private investors won’t wear the subsidy gap

Australia has $3.5 trillion of superannuation savings – the fourth-largest retirement savings pool in the world – but practically none of it is invested in Australian housing. The Treasurer wants to change that.

He’s talked a big game about encouraging private capital, including super funds, to invest specifically in social and affordable housing.

But no super fund should forego returns for its members by paying the subsidy gap for social or affordable housing out of members’ pockets.

It would be incompatible with superannuation funds’ core objective – maximising returns for their members – which funds are obligated by law to prioritise.

Private investors prefer affordable to social housing

If we make encouraging private investment in social and affordable housing the goal, we risk misallocating the scarce government subsidies we have.

Most super funds, and other investors, would typically prefer to invest in affordable, rather than social housing.

Doing so lets investors finance more homes for any given quantity of government housing subsidies that are available, while taking on less-disadvantaged tenants who are seen as less risky.

We’ve been here before: the National Rental Affordability Scheme spent $3.1 billion channelling subsidies to private investors for affordable housing.

Grattan Institute estimates suggest the scheme paid an extra $1 billion in windfall gains to investors, above and beyond the cost of the discounted rents offered to tenants, who typically weren’t the most needy.

Super funds could make social housing more expensive

Super funds can help finance the construction of new social housing via loans to community housing providers – as four major funds have recently agreed to do.

But these loans are likely to be on fully commercial terms.

They are deals attractive to federal and state governments worried about taking on more debt.

But they are also likely to make social housing more expensive to deliver because governments can borrow at lower rates than the returns sought by funds.

Governments can’t avoid their responsibility

Ultimately, governments have to foot the bill for social and affordable housing. And our priority should be social, rather than affordable housing, since its targeted at people at serious risk of becoming homeless.

The sooner that truth is acknowledged, the sooner we can get on with funding subsidies and the less time we will waste on trying to coax private investors into being something they’re not.

The best way to boost funding for social housing would be to double the size of the Housing Australia Future Fund from $10 billion to $20 billion

The government-owned fund uses borrowed money to invest in stocks and bonds and uses the income to cover the social housing subsidy gap.

It makes use of the higher return the government can get from investing than from retiring debt, in the same way as the government’s Future Fund.

Doubling the size of the Housing Australia Future Fund could support the building of up to an extra 30,000 social dwellings over the next five years.

Coupled with a further big boost to Commonwealth Rent Assistance, it could really help low-income renters.

This article was originally published on The Conversation. Read it here.

Why more employees are returning to the office in 2024

CBRE provides thoughtful, forward-looking insight into real estate trends, strategies and opportunities around the world.

CBRE’s latest research is forecasting a strong return to office in Australia and our experts analyse why.

What began as a global push to keep businesses open during the height of a pandemic is now one of the most debated topics in the modern employment landscape: hybrid work. 

While the hybrid work model sits high on the priority list of employee workplace benefits, it’s a more diplomatic setting with options rather than strict return to office mandates.  

What have leading researchers discovered regarding the latest office trends right now?  

The return to office in Australia will continue gathering pace after reaching 71 percent of 2019 levels in 2023, well above the 54 percent recorded in the prior period, according to CBRE’s 2024 Pacific Market Outlook report.

What’s bringing people back into the office 

The concept of a quality work environment continues to evolve alongside the return to office trend.  

CBRE’s findings indicate a clear trend of tenants looking to upgrade their premises. Almost three quarters of the office re-location decisions in major city CBDs have involved premises which commanded the same or higher market rents. For these re-locations, the median net face rent is an additional 10 percent ($/sqm), when compared to what may have been payable if the occupier remained in the same premises.  

This trend is attributed to drivers such as office location, commute time and access to public transport. 

What's more interesting though is the renewed appreciation for workplace design and office technology. Environmental features like natural light and better air quality now rank highly, alongside dedicated spaces for individual online meetings and focused work.  

Attracting Gen Z and Millennials into the office needs even more creativity from building occupiers, with considerations for parking, food and beverage options, and apps which inform when colleagues will be in the office. 

“Great experiences, social interaction and human connection are going to draw more workers into offices,” says Jenny Liu, Director of Workplace Consulting at CBRE

“Workplace experience is key to enticing people back to the office and these strategies fall under the key categories of people, place and technology. A workplace experience isn’t just environment, cool furniture and tech anymore. It’s the culture, ways of working, leadership, and how vibrancy is created. This is crucial because people are your most valuable asset, not your real estate footprint and office space.”  

There’s also the importance of leaders’ responsibilities to act as “magnets” for employees who want to learn from them and experience how they deal with clients. 

“They want to grow their profiles and meet other people in the business. How do you curate those moments where people stay? You can’t. You need leaders there to create the opportunities and connections.”  

CBRE Research Manager Thomas Biglands says that face-to-face interaction and collaboration are key to driving more employees back into the office, experiences that aren’t possible via remote work. 

“It’s important that you achieve a critical mass of visitation so that employees come in and feel as though the office is vibrant and full. It’s also important that enough coworkers and managers are in the office so that they see value from coming in. It defeats the purpose if workers show up to the office and end up being on Zoom calls all day.” 

The significance of focusing on workplace vibrancy also doesn’t escape Biglands, who says that ground levels and areas surrounding the building need to be amenity-rich and busy in order to create excitement around return to office.  

“Landlords, local businesses, and even government bodies play an important role in enticing employees back. Building activations and community events are key to enhancing the value proposition of any office tenancy.” 

Why premium offices are in demand  

The pursuit of more people in offices has allowed premium office spaces to thrive in recent times. 

Based on data tracked by CBRE, over 90 percent of office occupiers looking for space in 2023 indicated they wanted prime space (an average of Premium and A-Grade assets) while 45 percent indicated a preference for premium space. This has put pressure on landlords to uplift B-Grade assets. 

“Premium offices offer a high level of amenities and high ESG credentials,” explains Liu. 

“Think retail offerings, community events and yoga classes. A lot more tenants are focused on delivering the offerings from the broader precinct. If a property management team can create great events, the desire to leave decreases.” 

Liu knows this for a fact from her interactions with premium office clients in the field. 

“They do see the value in it. Most of the clients who engage us value their employees and the employee experience. They’re willing to move into premium assets with great amenity, invest in their people and ensure they know how to use their space and adopt the technology to work more effectively. 

“Higher levels of amenities paired with potentially smaller tenancy footprints are making premium assets a more viable choice for companies who might not have previously considered them. They’ll go to places that have great amenities because they care about that and are happy to pay the rents.” 

While client testimonials can help sway occupier business decisions, verifying the cost-benefit ratio is crucial. Biglands says that the best way to determine whether leasing premium office space is beneficial is to simply look at the decisions being made by other occupiers. 

“Occupiers have the best visibility into the contentment, performance and efficiency of their own workforces. The high demand for premium space and outperformance from a real estate perspective (vacancy rates, rental rate growth) shows that firms believe there is a benefit to leasing premium space. 

“They have made the internal decision that the marginally higher real estate costs add value to their operations and that this type of space makes their workforce happier and more effective.” 

The future of work from office 

Occupier demand for premium space isn't showing any signs of slowing to date.   

“Office is having its retail moment; it's going through a reset, not only from a valuation perspective, but also when you think about how tenants want to use the office space these days,” explained David Southon, Executive Chairman of Aliro Group, in a recent CBRE podcast.  

 “As the market continues to recover from the pandemic, leasing conditions will only tighten, and we’d expect rental rates to continue accelerating,” adds Biglands. 

“Minimal new supply coming over the next three to four years will limit availability of space even further. I don’t think premium space is going to get any cheaper over the near term and there are likely more options now than there will be going forward.” 

And while there could be some growth in peak day visitation across Australian cities, it’ll never reach the levels of the pre-pandemic five-day weeks in Liu’s opinion.  

“We will always have to offer some form of hybrid. It is an employee value proposition, and the next generation will expect some level of it. However, as occupiers look to better utilise and manage space, there could be more flattening of the peaks to spread out office use and ensure teams are coming in together for anchor days.”  

CBRE is currently in the process of moving its Melbourne and Sydney offices. Once complete, they will showcase some of the latest innovations in the workplace.  

“With everything from brokers to valuations to property management and corporate services, we must focus on creating a diversity of workspaces to suit our workforce. These people operate in different ways and we’re increasingly hiring diverse groups of people. We want to support them to realise their potential both in and out of work.” 

This article was originally publish on CBRE. Read it here.