Building for the future: opportunities and challenges in construction

Duncan Clubb is a Partner in the Business Restructuring Division of BDO Sydney. Charles Haines a Director at BDO Australia. Charles Haines is a Director in BDO’s Advisory team in Brisbane. Both Duncan & Charles bring a wealth of experience and knowledge which inform this analysis of Australia’s construction industry.

Turbulence or turmoil?'

The construction industry is one of Australia’s biggest sectors, but primarily due to COVID-19, the sector’s performance has been turbulent over the past two years. The 2020-21 financial year brought in $424.1B in revenue, but this is still a decline of 5.7 per cent on the previous financial year. Of this revenue, only $34.4B was profit (a fall of 3.1 per cent) and profit margins were as low as 8.1 per cent (a fall of 1.3 profit percentage).

While these figures have been exacerbated by COVID-19, the construction industry has always been tumultuous – with low profit margins, labour instability, and a high dependency on construction loans. These issues all contribute to why the construction industry accounts for almost 25 per cent of all insolvencies every year.

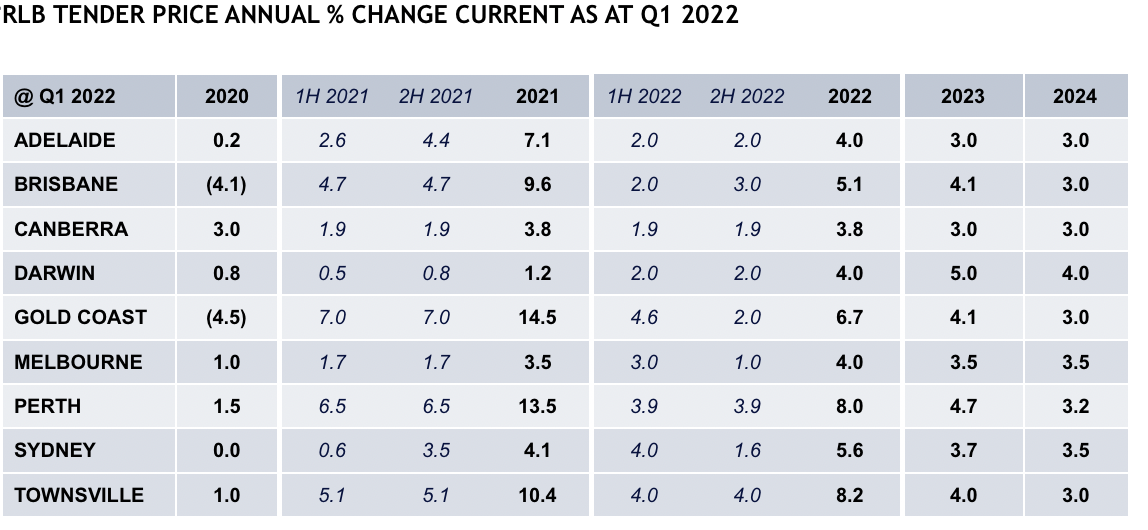
Construction demand consistently outpaces both supply for labour and raw materials, and is further worsened by global supply chain issues which have caused delays in projects, and added to construction costs. CoreLogic’s Cordell Construction Cost Index (CCCI) for Q1 2022 showed national residential construction costs increased nine per cent over the 12 months to March 2022, a rate of cost increase which would erode most of the profit on a residential building contract.

In the first two quarters of 2021-22, there were severe lockdowns in Melbourne and Sydney, as well as limitations on the number of workers allowed to operate onsite at any given time. This resulted in the partial or complete termination of some projects. These impacts proved difficult in an industry which depends on loans and timely project completion.'

The Homebuilder Scheme

In an effort to reinvigorate the construction industry and stimulate the domestic economy, the Federal Government announced the Homebuilder Scheme, but some believe this scheme may have caused more harm than good.

Since the announcement of the scheme on 4 June 2020, there have been almost 140,000 applications, resulting in huge numbers of approvals for new dwellings and scheme compliant renovations.

Despite customer numbers almost doubling, the number of building companies, skilled labour and materials did not. This ultimately resulted in delays to construction start dates and longer build times.

This subsidy-driven increase in demand resulted in building companies experiencing a significantly different risk profile, as elevated numbers of ongoing building projects increased their exposure to the market. This occurred at such a rate that their financial robustness (balance sheet strength) did not have time to catch up and develop sufficient reserves to buffer them against any potential pressure associated with this increased activity (i.e., margin pressure).

While unforeseen international events have certainly impacted the industry, it was foreseeable that:

  • Such sudden and dramatic increase in local demand would lead to cost pressures on labour and raw materials

  • Other countries would attempt to reinvigorate their economies through the construction industry – placing greater strain on international supply chains

  • The impacts of COVID would be ongoing, even if those impacts were unknown and not quantifiable.

Aftershocks and secondary impacts

A year can make a significant difference in a global supply chain environment. In construction, where residential contracts are almost always fixed price and the party bearing the risk is the builder, the impacts of a company failing can be felt on a wider scale than some other industries.

These wider impacts may affect suppliers providing goods on credit, employees that may be owed superannuation and/or other entitlements, homeowners who may lose their deposit or experience indefinite delays to the completion of their homes, and state-based home warranty schemes that need to investigate and support the homeowner’s claim.

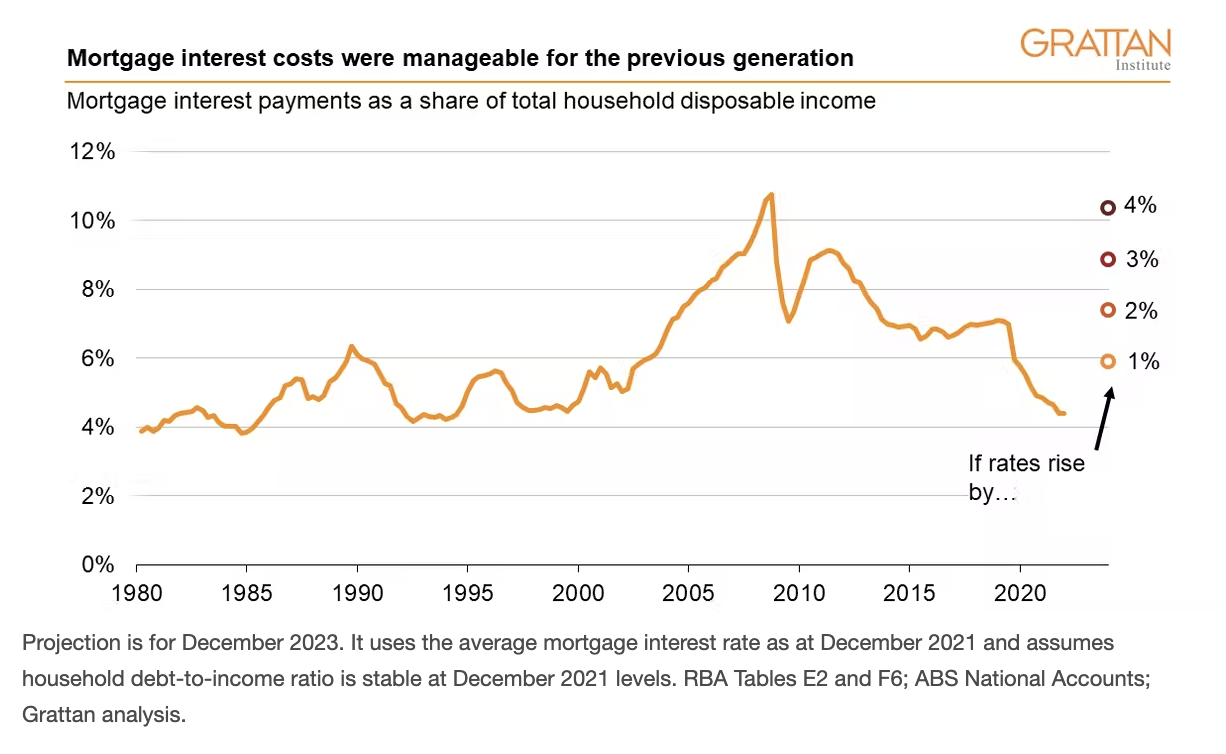
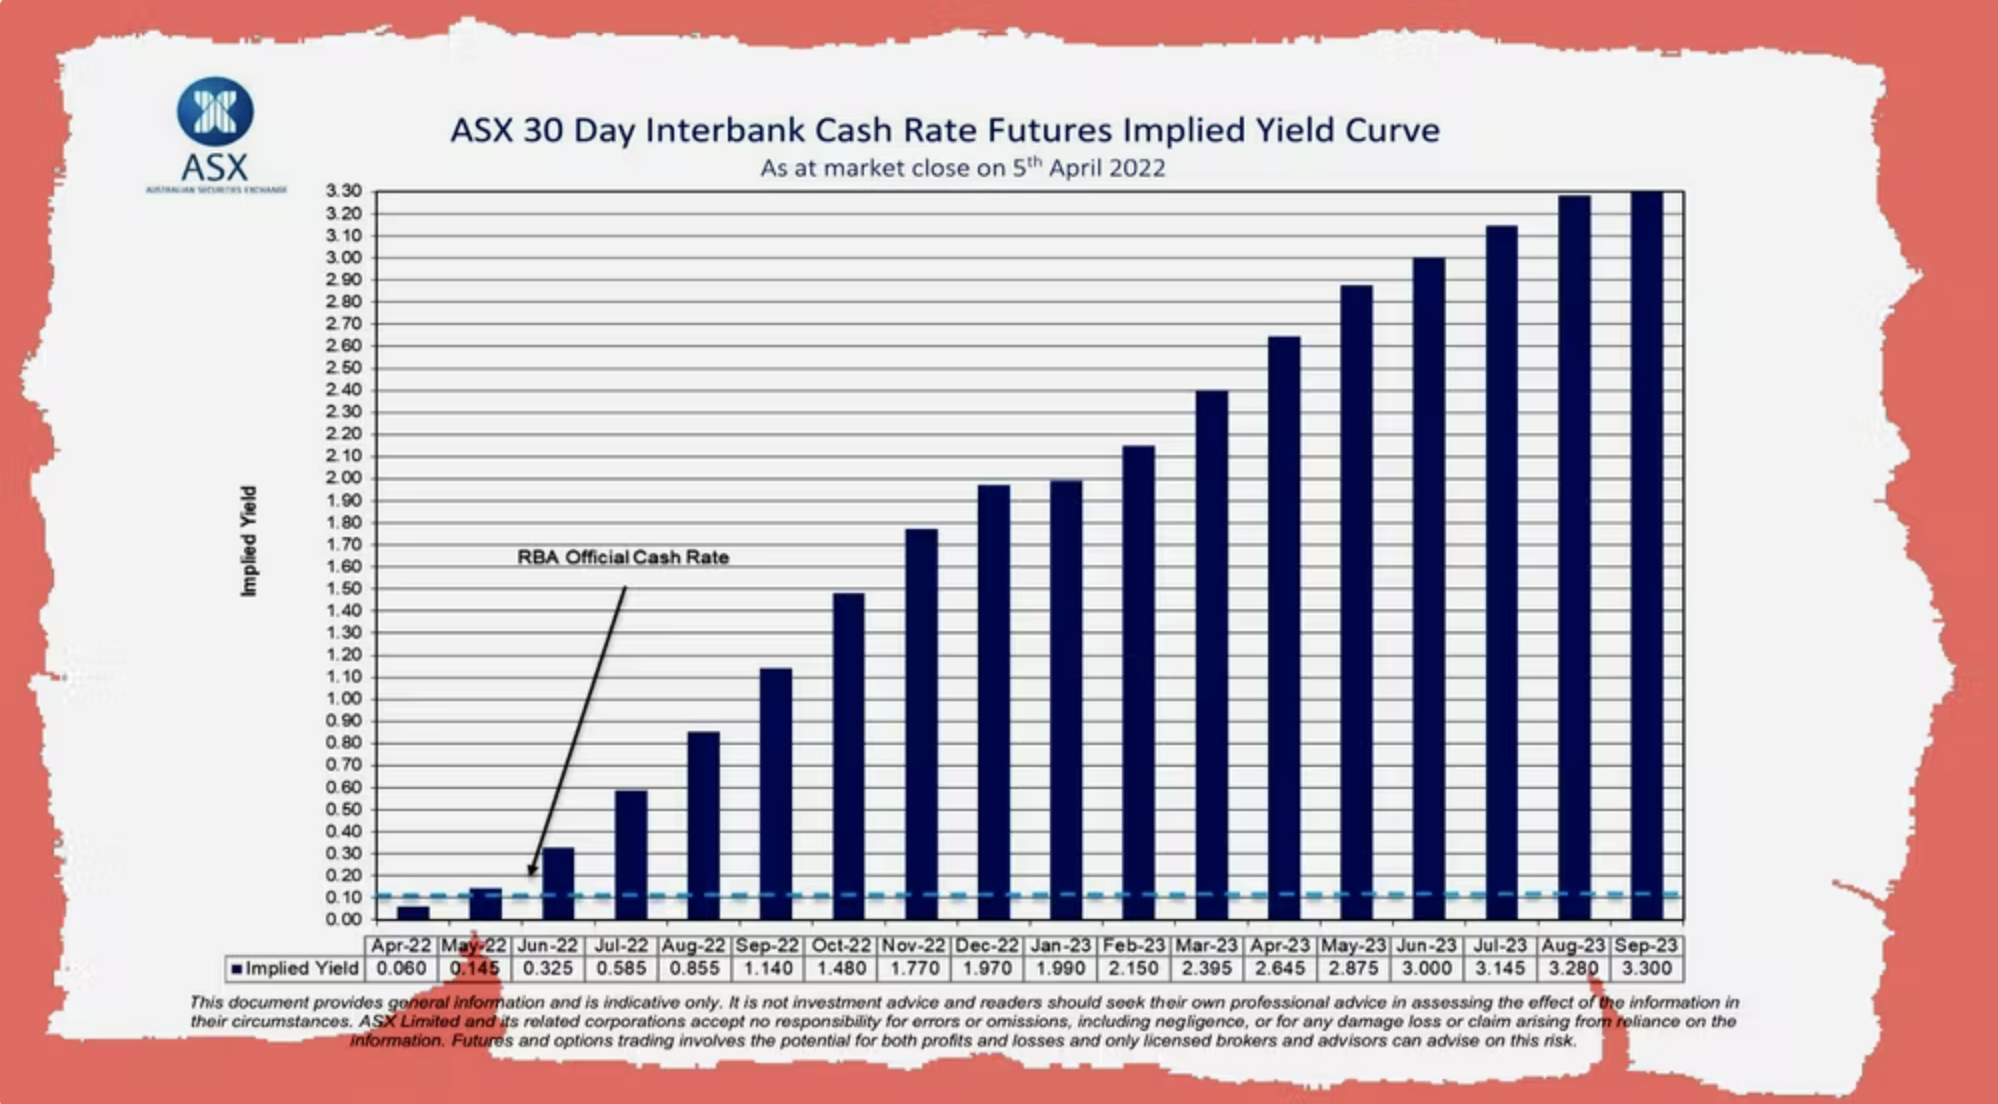
The past year has unfortunately provided no relief to the construction sector, with the industry facing the consequences of adverse weather conditions on the Eastern seaboard of Australia, supply chain issues such as the slowdown of steel manufacturing in China, tariffs of 35 per cent being imposed on Russian and Belarusian Engineered Wood Products (which comprise of approximately 40 per cent of Australia’s EWP imports), and on-going wage growth in the sector coupled with rising interest rates.

As a result, there has been a profitless boom in the construction industry which has led, and will continue to lead, to an increase in the number of insolvencies in the sector.

Navigating these challenging times

Some of these impacts were foreseeable, others were not - making them difficult to plan for. However, we suggest that construction businesses consider the following measures to reduce the adverse effects:

Measure twice, cut once

The concept of ‘measuring twice, cutting once’ is as applicable to project budgeting as it is on the construction site. Builders should ensure that their budgeting process is rigorous and based on current pricing for both labour and materials. Builders are also advised to budget for future price increases, based on the anticipated completion date of the project.

Know your suppliers

While it is often easy and preferable to use cheaper suppliers, it’s important to consider suppliers with a reputation for timeliness and quality. The cost of delays when obtaining key materials can often be far greater than the savings of going with the cheapest option.

Build your relationships

Relationships are more important than ever. Consider who you are doing business with – is it the right time to start new business relationships, or to continue with those you trust and can rely on?

Seek help early

If you are facing challenges in your business, reach out to your trusted adviser and engage with key stakeholders. The pressures you are facing are likely not isolated to your business, but industry wide.

This article was originally published on BDO Australia. Access it here…

The New Order Cometh: Rise of the Millennials

Dr Ameeta Jain is the Course Director of undergraduate programs at Deakin University. Ameeta is a passionate educator with more than 15 years of experience in lecturing in property, economics and finance units. She has led the development and enhancement of various courses. Ameeta's research centres around issues of sustainability and resilience in regions as well as property markets.  She has obtained government funding for projects aligned with the United Nations Sustainable Development Goals as well as industry funding to evaluate the resilience of housing markets. She has published in highly ranked national and international peer-reviewed journals as well as media pieces.

The 2021 Census data released in June 2022 reveals that for the first time Millennials (25-39 years old) have caught up with the Baby Boomers (55-74 years old) in terms of numbers. In comparison with the 2011 census, Baby Boomers decreased from 25.4% to 21.5% of the population whereas Millennials increased from 20.4% to 21.5%. This decline in the importance of the Baby Boomer generation as the dominant force in the residential real estate market is likely to change the demand profile for housing across Australia.

Natural attrition due to death, and increased age of the Baby Boomers means that firstly there is likely to be an increase in the sale of deceased real estates over time. Secondly, demographers theorise and hope that Baby Boomers will increasingly be looking at rightsizing (smaller house size but similar budget) where the empty nesters consider moving inner city to a smaller house with a holiday house thrown into the mix. At this time, there is no financial or other incentive for Baby Boomers to sell their family homes and move. On the contrary, there are downsides to selling a valuable family home, with both financial and non-financial penalties. These include loss of friends, environment and neighbourhood, sale proceeds reducing aged pension and other benefits, and loss of amenities. None of these non-financial considerations has been addressed by government policy. Given that Baby Boomers own more than half of the residential real estate in Australia, appropriate policy measures to wean them from their family homes and to move to more appropriate (in terms of size) housing are required. It would be presumptuous to assume that Baby Boomers comprise a homogenous group of well-off retirees. Like in other generations, this cohort comprises many who will continue to work for myriads of reasons well past 65, some do not even own their houses, others are a part of the sandwich generation, caring for their parents from the silent interwar generation and their own children/grandchildren. These confounding factors, along with many others, keep housing markets operating inefficiently in the eyes of theorists and policy makers. 

Opportunity for Millennials: maybe not

On the face of it, the power of increased numbers is supporting the Millennial generation in their quest for increasing home ownership. Prior studies demonstrated that the Millennial generation wants their housing to reflect their changing lifestyle, ethos and values: large master bedroom, en-suites, modern interiors, energy efficiency, bigger kitchens, low maintenance living and location all at the right price. This is different from the requirements of the Baby Boomer generation previously: smaller houses with bigger yards, dated interiors and exteriors. This is reflected in the current housing stock in Australia held by Baby Boomers. However, when Baby Boomers rightsize, they may well be competing with Millennials for the same properties.

Some studies have shown that Millennials are increasingly looking at innovative methods for getting their foot in the property market: buying affordable housing to rent out and renting in their preferred area (rentvesting); buying as a part of a property syndicate; or buying with friends and family. 

Where to from here?

In the ideal world property markets would be completely efficient and follow ideal theoretical constructs, ensuring that Baby Boomers would downsize as soon as society regards that they should, and the next generation move into established family housing. However, reality is very different. There needs to be a policy shift by federal and state governments recognising that the Baby Boomer generation is unlikely to give up their hard-earned wealth (despite all arguments to the contrary). Unless it can be ensured that the Baby Boomers will not be financially worse off by rightsizing or downsizing, there is unlikely to be any significant increase in Millennials owning more properties. Even in the presence of appropriate policy measures, non-financial factors preventing Baby Boomers from giving up their family homes will prevent a complete handover of existing housing stock from the Baby Boomers to the Millennials. This complex problem requires governments to not just provide Baby Boomers with the option to rightsize/downsize without financial penalty, at the same time developing innovative policies and programs to help millennials to buy into the residential property market.

Embodied carbon: What’s happening globally and why must Australia get ready?

Tom Dean is the Director of Carbon Planning at Slattery, and is one of the nation’s leading Quantity Surveyors. Tom has been instrumental in shaping Australia’s property landscape, and led the development of Australia’s first carbon planning service, which is now endorsed by GBCA and MECLA. Tom gives insight into how the construction industry can better achieve net-zero objectives through policy and innovation.

As global regulation shifts gears and more countries begin to measure and manage construction’s embodied carbon emissions, the signposts show Australia what’s ahead on the road to net zero.

According to the World Green Building Council, buildings are responsible for 39% of global carbon emissions: 28% generated during the operational phase to heat, cool and power them, and the remaining 11% from materials and construction [1].

The property and construction industry has focused on that 28% by reducing operational carbon emissions through more energy efficient design, smart building technology and behavioural change campaigns.

As operational energy consumption decreases, the remaining 11% – known as embodied carbon – is expected to become the dominant source of greenhouse gas emissions.

The Green Building Council Australia (GBCA) estimates embodied carbon emissions could be responsible for 85% of the built environment’s carbon emissions by 2050 [2].

Targeted action to reduce embodied carbon emissions is therefore crucial for Australia to meet its net zero emissions target by 2050 [3].

Mandates gain momentum

Regulation of embodied carbon in the built environment is gaining momentum. Embodied carbon assessments are being incorporated into planning, building and procurement requirements in a growing number of countries around the world [4].

The New Zealand Government recently released its Emissions Reduction Plan, for instance, and is expected to introduce reporting requirements and caps for embodied carbon and operational emissions in new buildings.

In France, a new embodied carbon emissions policy, which came into force on 1 January 2022, dictates embodied carbon caps for different building typologies. By 2031, all new buildings in France will have an embodied carbon footprint 52% smaller than in 2022 [12].

The Netherlands, the first country to impose mandatory embodied carbon assessments for non-governmental buildings, has required new residential and office buildings over 100 sqm to submit embodied carbon reporting as part of the building permit application process since 2018. The Netherlands also has a national environmental product declaration database, a standardised method for whole building lifecycle assessment, and several software tools that follow the standardised method [13].

And then, in the United States, several federal and state government administrations have implemented low embodied carbon procurement policies. These initiatives aim to drive change within the supply chain and accelerate the development and availability of lower carbon materials to the wider market.

New York City, for instance, is currently targeting 40% less embodied carbon by 2030 and net zero embodied carbon by 2050 for new buildings, infrastructure and renovations projects.

Signposts point in one direction

These national commitments are just five signposts of dozens that point us to the future for embodied carbon measurement and management. But where does Australia stand?

With no mandatory regulations for embodied carbon measurement, reporting or reduction, Australia is currently lagging many international peers. The recent change in federal government has elevated environmental priorities, and we expect to see regulation on embodied carbon emissions introduced within the next few years.    

With funding from the NSW Government, the National Australian Built Environment Rating System (NABERS) is currently developing a new framework to measure, benchmark and certify embodied carbon from building materials and construction. This framework is due to be finalised in the next 12 to 18 months. The framework is intended to roll out nationally as a voluntary rating for commercial buildings, with the potential to enable mandatory planning policy in the future [26].

The Green Star Buildings rating tool, released by the GBCA in 2020, includes upfront embodied carbon reduction criteria for the first time. These criteria will become more stringent over time, and by 2030 all Green Star certified buildings will need to demonstrate at least 40% less upfront embodied carbon emissions when compared to a reference building.

So what can Australia’s construction industry do now?

Australia, as a signatory to the Paris Agreement, has committed to net zero carbon emissions by 2050. The construction industry currently accounts for approximately 25% of all greenhouse gas emissions in Australia – which puts it on the front line of action [27]. A net zero carbon future is only possible if we tackle embodied carbon.

The World Economic Forum's 2022 Global Risks Report finds “climate action failure” is now the biggest global threat and that a disorderly transition to net zero looms. Australia’s property and construction industry, backed by government, can take strategic steps now to support an orderly transition to net zero.  

The first strategic step to tackle embodied carbon is to establish a national industry-agreed methodology and framework for measuring and reporting embodied carbon. This would ensure that meaningful comparisons can be made between projects. NABERS is developing this framework in collaboration with industry stakeholders including Slattery.

Secondly, embodied carbon targets, thresholds or caps are likely to be set based on industry benchmarking data. Over time, these targets will be tightened to deliver increasing emissions reductions while driving design efficiencies and material innovations. Embodied carbon emissions targets will likely then be mandated or incentivised by government.

Finally, the new Albanese Government can look at applied policies abroad to guide Australia’s embodied emissions policies and to guide an orderly transition toward a decarbonised construction industry.

The bottom line? Companies that begin to measure the embodied carbon in their projects now will upskill their workforce, drive a shift in culture and get ahead of inevitable regulation. 

Bibliography

[1]

W. G. B. Council, "Bringing Embodied Carbon Upfront," 2019. [Online]. Available: https://worldgbc.org/news-media/bringing-embodied-carbon-upfront. [Accessed June 2022].

[2]

J. Vickers, S. Warmerdam, S. Mitchell, N. Sullivan, J. Chapa and S. Qian, "Report on embodied carbon and embodied energy in Australia's buildings," 2021.

[3]

"NABERS," [Online]. Available: https://www.nabers.gov.au/publications/nabers-embodied-emissions-initiative. [Accessed May 2022].

[4]

"Royal Institute of Chartered Surveyors - RICS," [Online]. Available: https://www.rics.org/oceania/wbef/megatrends/natural-environment/the-other-side-of-the-coin-understanding-embodied-carbon/. [Accessed May 2022].

[5]

"New Zealand Government," May 2022. [Online]. Available: https://www.building.govt.nz/about-building-performance/all-news-and-updates/emissions-reduction-plan-released-by-government/.

[6]

New Zealand Government, "Whole-of-Life Embodied Carbon Emissions Reduction Framework," New Zealand Government, 2020.

[7]

N. Z. Government, "Embodied Carbon Assessment Technical Methodology," 2022.

[8]

J. Hahn, "Dezeen," 2 February 2022. [Online]. Available: https://www.dezeen.com/2022/02/02/duncan-baker-carbon-emissions-buildings-bill-news/. [Accessed May 2022].

[9]

London Energy Transformation Initiative, "Defining and Aligning: Whole Life Carbon & Embodied Carbon," [Online]. Available: https://www.leti.london/carbonalignment.

[10]

F. Varriale, "Royal Institute of Chartered Surveyors," 27 May 2021. [Online]. Available: https://www.rics.org/oceania/wbef/megatrends/natural-environment/the-other-side-of-the-coin-understanding-embodied-carbon/. [Accessed May 2022].

[11]

"Database for environmental product declarations (EPD)," 2022. [Online]. Available: https://www.health.belgium.be/en/database-environmental-product-declarations-epd.

[12]

F. Bourgeon and J. Giddings, "How the emerging environmental regulations will apply to new buildings in France," Architectscan.org, 2 July 2021. [Online]. Available: https://www.architectscan.org/post/environmental-building-regulations-france.

[13]

Ryan Zizzo, Joanna Kyriazis, Helen Goodland, "Embodied Carbon of Buildings and Infrastructure - International Policy Review," Forestry Innovation Investment Ltd, Surrey, 2017.

[14]

G. Richards, "Good for wood: new embodied carbon regulations," Stora Enso, 27 January 2022. [Online]. Available: https://www.storaenso.com/en/newsroom/news/2022/1/good-for-wood-new-embodied-carbon-regulations.

[15]

O. C. LCA. [Online]. [Accessed June 2022].

[16]

"Passive House Plus," 29 March 2021. [Online]. Available: https://passivehouseplus.co.uk/news/general/denmark-sets-out-phased-embodied-carbon-targets-for-buildings.

[17]

M. Kuttinen, "Method for the whole life carbon assessment of buildings," Ministry of the Environment, Helsinki, 2019.

[18]

"Carbon Leadership Forum," 1 March 2021. [Online]. Available: https://carbonleadershipforum.org/rmi-government-embodied-carbon/. [Accessed May 2022].

[19]

M. Lewis, "Carbon Leadership Forum," 10 July 2021. [Online]. Available: https://carbonleadershipforum.org/states-act-to-reduce-embodied-carbon/. [Accessed May 2022].

[20]

"Mantle Developments," 12 January 2021. [Online]. Available: https://mantledev.com/insights/embodied-carbon/buy-clean-california-embodied-carbon/. [Accessed May 2022].

[21]

S. Carlisle, B. Waldman, M. DeRousseau, L. Miller, B. Ciavola, M. Lewis and K. Simonen, "Buy Clean California Limits: A Proposed Methodology for Assigning Industry-Averag GWP Values for Steel, Mineral Wool and Flat Glass in California," Carbon Leadership Forum, Seattle, 2021.

[22]

New York Building Congress, "Building the future of New York: Net-zero whole life carbon," New York Building Congress, 2021.

[23]

M. O. J. M. J. S. J. a. C. R. Bowick, "National guidelines for whole-building life cycle assessment.," National Research Council Canada, Ottawa, ON., 2022.

[24]

W. G. B. Council, "Bringing embodied carbon upfront," 2019.

[25]

M. Read, "Green Building Canada," 31 May 2022. [Online]. Available: https://greenbuildingcanada.ca/2022/vancouver-building-emissions-reductions/. [Accessed 07 June 2022].

[26]

Z. Teshnizi, "Policy Research on Reducing the Embodied Emissions of New Buildings in Vancouver," Zera Solutions, 2019.

[27]

D. Murray, "Embodied carbon is coming to NABERS and planning in NSW," The Fifth Estate, 29 October 2021. [Online]. Available: https://thefifthestate.com.au/business/government/embodied-carbon-is-coming-into-nabers-and-planning-policies-in-nsw/.

[28]

I. Martek and M. R. Hosseini, "The Conversation," 15 January 2019. [Online]. Available: https://theconversation.com/buildings-produce-25-of-australias-emissions-what-will-it-take-to-make-them-green-and-wholl-pay-105652. [Accessed May 2022].

[29]

M. O. J. M. J. S. J. a. C. R. Bowick, "National guidelines for whole-building life cycle assessment," Ottawa, ON, 2022.

Construction industry collapses are caused by the wrong builder, not the wrong contract

Andrew Schwartz is the Co-Founder and Managing Director of investment management group Qualitas. Andrew oversees the firm’s activities, particularly concerning improving strategic direction and relations with clients and investors.

Covid and its associated lockdowns and supply chain blockages have been tough on Australia’s property construction sector. An inability to source labour and materials has resulted in steep rises in costs and substantial project delays, which have wiped out margins and in recent months driven some of the industry’s highest-profile names to the wall.

Around the country, there is heightened anxiety regarding unfinished residential and commercial projects, developers considering alternative builders, subcontractors and tradies waiting to be paid, and would-be homeowners and investors wondering what this means for the apartment they’ve bought off the plan.

The industry is also looking for answers. Why has this happened? And what can be done to prevent it happening in the future – beyond preventing global pandemics?

It’s no surprise that attention has turned to Australia’s preference for Design and Construct contracts. There are suggestions we should look to the US, where D&C contracts are far less common and developers, not builders, take on more of the risk and responsibility of a new development.

Superficially, that may appear attractive. Surely developers should be more responsible? But it would be a serious mistake. D&C contacts have served Australia well through multiple property cycles and remain the best option for allocating risk and incentivising project completion, quality and innovation in design.

In Australia, there are several types of commercial contracts for large residential projects – our focus for this article, although it’s the same situation with commercial projects. There’s a construction management agreement, with no fixed price and much of the cost risk and design risk borne by the developer. There’s a gross maximum price contract, which is a better option for developers although they still carry design risk. And there are D&Cs with a gross maximum price (GMP) or a fixed price.

The principal benefit of D&C GMP contracts, which are by far the most popular for larger projects, including large-scale infrastructure projects, is that the many risks are assigned to the maximum extent possible to the one party best able to manage them – the major contractor or builder. A D&C contract makes it clear that the builder is responsible for the delivery and construction of the project in accordance with the detailed design plans.

The reason for this approach is to reduce the risk of disputes and litigation between the many parties to a major project – the developer, the financiers, off-the-plan purchasers, the head contractor and their subcontractors, the multitude of design, engineering and planning consultants and the surveyors.

Effectively, all roads lead back to the builder. If there are any problems – the project is late, there are cost blowouts, pre-sales fall over because there are design faults, there are warranty claims after completion – it is the builder’s responsibility to deal with it. There is a direct and central point of liability in the event something goes wrong.

This makes D&C contracts attractive and fundamental from a financier’s point of view. But it also highlights why the financial strength, experience and track record of the builder is paramount in any project.

The key argument against D&C contracts, which has gained currency with the spate of recent collapses, is that they remove the responsibility from the developer because they have passed all the risks to the builder. This betrays a misunderstanding of the role of developers and the amount of skin they have in the game.

In Australia, the funding of costs for a major residential project is typically 70 per cent debt – from a bank or, increasingly, from alternative lender – and 30 per cent equity from the developer. The developer will also be eyeing a 20 per cent profit margin. On a $200m development that’s up to $100m of at-risk equity and profit, so it’s nonsense to say developers are not motivated to deliver a successful project on time and on budget.

In the US, where D&C contracts are rare and prohibitively expensive, a developer typically has even more skin in the game but there are significant downsides, particularly when something goes wrong.

Unlike Australia, in the US more of the risk emphasis is placed on the developer and the strength of their guarantee to the financier, as opposed to the contractor’s guarantee. This results in a substantial shifting of risk away from the contractor to the developer. It results in the dilution of the risk matrix.

In the US, the equity risk is so profoundly different to that in Australia that equity raisings have complicated tiering structures of differing risks depending on which tier of equity you subscribe to. It’s a complicated and inferior system to that in Australia where all roads lead to one party being the contractor – the party that actually did the work and had responsibility for all other subcontractors and consultants.

In the litigation capital of the world, you can imagine the outcome in the event of a problem with a project. Without the single point of liability under the D&C system, everyone blames everyone else and lawsuits fly.

Doing away with D&C contracts in favour of such a system is simply not the answer to the current problems facing the construction sector. It would introduce greater risks for developers, financiers and, ultimately, for homeowners and investors. In addition, by requiring developers to put up more equity to cover increased risks, it would lead to higher development costs and higher apartment prices that would only exacerbate the current housing affordability issues.

The current problems in construction are not about the wrong contract. In most cases where there is failure, it’s about developers choosing the wrong builder. You may have the best-in-class suite of contracts and risk assessments, but you need the appropriate builder to execute according to the terms of the contract.

As a financier, before we put up any funding we naturally assess all the risks and returns of a project.

One of the most important considerations is the scale and quality of the builder, specifically whether they have the experience and balance sheet to carry out a particular project and cover the financial burden of any problems that emerge.

The temptation in a climate of rising costs – including the cost of capital – is for developers to look for cut-price construction options, including taking on cheaper but riskier GMP contracts without a D&C component. The more inexperienced the developer, the more likely they are to run into problems managing the D&C components with the builder, leading to cost blowouts and delays. Even with a D&C GMP contract, the lowest bid is typically from the lowest-capitalised, least experienced builder. In a costs crunch, as we’ve seen through Covid, they will be the first to fail.

We have one of the best contractual arrangements anywhere in the world, designed to ensure a clear pathway of responsibility to contractor. The D&C contract attributes responsibility for the design of the building, the structural integrity, performance, and warranties with the builder. There is no gap for error – unless you choose the wrong builder due to an incorrect assessment of their financial capacity.

How are circular economy principles taking hold in real estate?

JLL is a world leader in real estate; buying, building, and investing in a variety of assets including industrial, commercial, retail, residential and hotels. The company gives insight into how greening goals are being imagined in real estate.

Leading cities are now setting goals to tackle carbon throughout a building’s lifecycle…

Decarbonizing cities will take more than cutting carbon emissions from buildings operations.

As cities commit to ambitious net zero targets, the most progressive among them are now considering how they can better plan building lifecycles, from construction to maintenance and ultimately, demolition. The construction industry is the world’s biggest producer of waste. In the EU, construction and demolition waste accounts for approximately one-third of total waste, and around 40 percent of solid waste in the United States.

That needs to change – and quickly – if cities are to achieve a net zero future. It’s why circular economy thinking, which aims to eliminate waste, is growing in popularity. It has profound implications for decarbonizing cities because it factors in whole-life emissions – the carbon generated by producing and transporting materials through to their use and disposal.

“Circular economy principles are about preserving the value of assets by embedding zero-waste thinking early in the lifecycle and designing with reuse or repurposing in mind,” says Cynthia Curtis, SVP and Corporate Sustainability Officer, Americas at JLL. “They redefine the concept of waste, recognizing the value in the materials. Reducing the carbon emissions of planned new buildings can significantly help the transition to net zero.”

However, that’s only part of the solution. In North America and Europe, for example, around 80 percent of buildings that will be in use in 2050 already exist today and will fall far short of future carbon reduction targets. Yet knocking down an old building to build a new, greener building, is not an effective approach.

“Retrofitting older buildings is so important; the carbon has already been spent in creating that structure,” adds Curtis. “Through reuse and repurposing, the spent carbon can be leveraged more efficiently.”


Regulations on the horizon

Incoming regulations in major cities are increasingly front of mind for developers. Amsterdam will halve the use of new raw materials by 2030 on the road to being fully circular by 2050.

Los Angeles is aiming to be the largest city in the U.S. to achieve zero waste, targeting a 90 percent landfill diversion rate by 2025, while Melbourne is also on a similar path. 

Paris, which wants 50 percent of construction sites to send no waste to landfill by 2030, is leading the way with Design for Reuse Principles. These encourage developers to focus on projects that can accommodate different functions over time – housing, offices, hotels – without the need for renovations or major upgrades. By 2030, 30 percent of its office stock will need to be adaptable.

“The principle of reuse has a much wider context than simply decarbonization – it’s about being able to respond to changes in the future of work or in social patterns,” says Jeremy Kelly, Global Research Director, City Futures at JLL. “It addresses how the value of assets can be maximised over the long term, and how our building stock can be better managed.”

New materials drive progress

Ongoing shortages of construction materials have also contributed to a growing awareness of the need for circular principles in real estate. 

“We’ve seen a significant increase in client inquiries about waste management strategies,” says Curtis. “Waste reduction is a direct precursor to a circular economy because the most effective method is to design for reuse at the outset.” 

At the same time, there’s a growing range of reusable materials supporting circular construction, such as Cradle to Cradle (C2C) products that can be returned to manufacturers for repurposing.

Carbon-negative materials including mycelium insulation and certain bioplastics remove carbon from the atmosphere during production. Innovations in manufacturing have also led to carbon-neutral concrete and lower-carbon steel.

A new generation of sustainable developments are spearheading such products. Amsterdam’s mixed-use Park 20|20, which features one of the world’s largest collections of C2C materials such as reusable structural frames, is one of the protagonists.

In Hamburg, Landmarken AG is currently building Germany’s first residential complex where more than 50 percent of materials were selected with reuse in mind – and many are Cradle to Cradle certified. Schemes like London’s Whole Life-Cycle Carbon Assessment and Paris’ RE2020 will encourage more such developments in the coming years.

“Cities with regulations to encourage considerations of whole-life carbon and building adaptability see greater traction more quickly,” says Curtis.

Regulation lags market forces

Despite the headline actions of leading cities, legislation is lagging in many others. Market pressure from businesses who increasingly seek low-carbon, low-waste spaces is having a greater impact, says Kelly.

One challenge is that the cost of circular design can initially be higher, but it can cover several traditional building lifecycles.

The lack of financial incentives, education and regulatory guidance can also make it more difficult for businesses to adopt a circular mindset, notes Curtis, holding back the industry-wide change necessary for circular construction.

“The building lifecycle involves many players – investors, developers, architects, manufacturers, contractors and suppliers,” says Kelly. “To embed circularity in this complex value chain requires much deeper collaborative business models. And we need this transition to drive the sustainability progress that’s paramount for the built environment.”

This article was originally published on JLL’s website, read it here

Melbourne Housing Market – Demand and Supply Outlook

Richard Temlett is an Associate Director in Charter Keck Cramer's Strategic Research department. A former lawyer, Richard exercises an evidence-based approach when validating investment and development decisions. Richard gives insight into how the divide between supply & demand will affect Melbourne housing over the next few years.

COVID-19 has caused a substantial demand-side shock to the Melbourne housing market. There is likely to be a mismatch between supply and demand over the next 2-4 years and this will be exacerbated by rising construction costs and increasing interest rates. 

Introduction

The Australian economy has undergone significant disruption as a result of COVID -19 through 2020-2022.  On balance however, the economy has performed far better than expected at the commencement of the pandemic and this is due to an unprecedented level of monetary and fiscal policy stimulus provided over 2020 and 2021. 

The demand-side shock caused by COVID-19, as well as the monetary and fiscal stimulus, has had a substantial impact on the demand for and supply of housing across Australia and Melbourne. Some of the impacts as they apply to the Melbourne housing market are highlighted below. 

Demand-Side Impacts

It is important to keep in mind that population growth drives the demand for additional and diverse forms of dwellings and has been a major driver of the Melbourne housing market over the last two decades.

In the period prior to COVID -19, population growth was extremely strong in Victoria (peaking at 150,000 p.a) and Melbourne (peaking at 130,000 p.a).  COVID -19 has had the greatest impact on the inner-city apartment market in Melbourne due to this sub-market’s large reliance on migrants and students. Population growth in Victoria has fallen to a negative 44,700 in FY 2021 whilst population growth in Melbourne has fallen to a negative 49,000 in FY 2021. 

On a positive note, population growth is anticipated to return to both Victoria and Melbourne from 2023/24 onwards as the State and City are still very attractive places to live.  Charter notes that Victoria will be the fastest growing State in Australia from 2023/24 and Melbourne is forecast to be larger than Sydney by 2029. 

Supply-Side Impacts

The chart below shows the building activity of new dwellings across Melbourne for the period March 2003-March 2022. Building approvals are an indicator of future supply of dwellings to enter the market and it is important to understand in more detail which types of dwellings are being delivered across Melbourne. 

New dwelling activity peaked between 2016-2018 and was driven by the local and overseas investor markets during this time. Prior to COVID -19, there was a strong decline in supply (underpinned by reduced releases) as the market adjusted to increased policies targeting local and overseas investors, overarching market softening created by the uncertainty of the Banking Royal Commission as well as the Federal Election.

Charter observes that the detached housing market has been the primary beneficiary of the unprecedented monetary and fiscal policy response over 2020 and 2021 in response to COVID-19. This was because the various incentives (particularly Homebuilder) had construction commencement timing requirements that the detached housing market was able to meet.  

The apartment market, for the most part, was not able to take advantage of these incentives and also was at the disadvantage of relying on investors (both local and foreign) to support presales prior to many projects obtaining construction finance.  Investors were initially more cautious at the commencement of COVID -19 although they have entered the housing market over 2021 and 2022. 

Prices

The chart below shows the median house and unit (townhouses and apartments) prices across Melbourne for the period March 2005-March 2022. Established house prices are a reflection of the demand / supply balance and set the context in which more affordable dwellings such as townhouses and apartments can feasibly be delivered in a market. 

Melbourne’s median house price rose by +66% between June 2012 and its peak of $903,000 in December 2017.  Following a softening across the market the median house price recorded a new peak of $1,076,800 as at March 2022. The median unit price recorded $659,100 as at March 2022 and represented a -39% discount to the median house price.

As highlighted above, the Melbourne housing market recorded significant price growth as a result of several factors including the COVID-19  related monetary and fiscal policies.  Between June 2020 and March 2022 median house price growth was recorded at +24%.  Median unit prices have recorded robust price growth although not to the extent of that recorded across the housing market (+13% growth).

Charter notes that unit prices track house prices. If one dwelling type increases or decreases in value, the market does recalibrate and the other dwelling type will subsequently increase or decrease in value. The gap between house and unit prices is currently extremely large and it is anticipated that in various sub-markets there will be price growth in units in Melbourne over the next 12 months. 

Construction Costs

Charter has considered the price indices of residential housing across Melbourne to understand the change in prices across various materials used in the construction of housing. 

Price increases across various items are the highest since the introduction of the GST in 2000 (or in some instances since the GFC in 2008/2009). This has led to an overall increase in costs across Melbourne (across all price groups tracked by the ABS) of +15.4% since the start of COVID-19.

Charter’s investigations with the industry suggest that to date revenue increases in the greenfield markets have been greater than cost increases and these costs have been able to be passed on to the purchaser in the form of higher prices. This is not the case in the medium and high-density space where revenues have not increased as much as costs and projects are no longer feasible.

Finally, industry sentiment is that house building costs will increase by around another +10-15% over the next 12 months and there is tremendous uncertainty with respect to the impact of China's COVID-zero policy, as well with the war in Ukraine.

Outlook

There is a lot of uncertainty in the housing market at present. Some of the key local factors causing this uncertainty and negative sentiment include rising interest rates, increasing construction costs as well as inflation whereas the global factors include the war in Ukraine, the Chinese Covid-zero policy and Global inflation.

The figures outlined in this article show that demand (both renter and buyer) will return in large numbers from 2023/24 whilst the supply of dwellings is slowing (and is likely to slow even further) over the next few years. It is important to keep in mind that supply takes time to mobilise and will not be able to quickly respond to returning demand. 

This presents both risks and opportunities across various sub-markets of which developers, financiers, investors, owner-occupiers and renters need to be aware.

Swapping stamp duty for land tax would push down house prices but push up apartment prices, new modelling finds

Professor James Giesecke is the Director of the Centre of Policy Studies at Victoria University, where co-author Jason Nassios is an Associate Professor. James has has published over fifty papers in peer-reviewed journals, and has over twenty-five years of experience applying economic models to diverse domestic and international public policy questions through contract research engagements with government.

In Tuesday’s budget, NSW will announce a switch from stamp duty to land tax.

It will become the second Australian jurisdiction to do so, with the ACT halfway through a 20-year switchover.

Homebuyers who accept the offer will be taxed annually on the value of their land, instead of hit with an upfront fee (that averaged $50,000 for Sydney in 2018) when they buy.

Once they have accepted, their property will be out of the stamp duty system and subject only to land tax for future owners.

It’s become conventional wisdom to say that such a revenue-neutral switch would boost productivity.

Why? Moving house sets in motion a chain of transactions: residents engage lawyers to transfer titles, real estate agents to manage the property sale, removalists to transport possessions, and so on.

Stamp duties compound these costs, by adding a significant, additional layer of taxation, which in some states makes up 80% of the total cost of moving house.

Land tax, in contrast, is one of the least-damaging taxes. It encourages land owners to put land to its highest-value use.

In a landmark modelling exercise completed this month, my team at the Victoria University Centre of Policy Studies finds that the productivity gains are large by the standards of tax swaps.

After 20 years, replacing stamp duty with a land tax would boost national income by A$0.30 for each dollar of revenue swapped, or up to $720 per household if implemented Australia-wide, about 0.34% of annual gross domestic product.

Of greater interest for homeowners and buyers is what it would do to prices.

Houses versus apartments

Broadly, we find that the switch would put downward pressure on prices, but not for every type of home.

Apartments are different. Shutterstock

Across the market as a whole, we expect downward pressure on the price paid by buyers of about 4.7%, and downward pressure on the price received by sellers of about 0.1%.

But for houses, we expect much stronger downward pressure than the average suggests.

We expect the price paid by house buyers to fall by about 7.6%, and the price received by sellers to fall 3%.

Interestingly, for apartments we expect movements in the other direction, pushing up the price paid by buyers by 2%, and pushing up the price received by sellers by 6.4%.

What’s so different about apartments?

Why would the switch put downward pressure on the price of houses but upward pressure on the price of apartments?

It is because of how two offsetting effects play out.

One is that higher land taxes depress land prices. Buyers who know they will be lumbered with future bills find their purchases less valuable. This effect is much bigger on house prices than apartment prices, because houses occupy more land on average.

The other effect is that removing stamp duty not only removes an impost on the current buyer, but also removes an impost that will have to be paid when the current buyer sells, and when the subsequent buyer sells, and so on, making resale more valuable to the current buyer than it would have been.

For properties that aren’t turned over often this effect isn’t very important, but for properties that are turned over frequently, it becomes significant.

Apartments are turned over twice as frequently as houses, meaning that for apartments the upward effect on prices from removing stamp duty overwhelms the downward effect from imposing land tax.

Much depends on exactly what’s proposed

It would be possible to lessen this upward pressure on apartment prices by imposing higher land taxes on higher density housing, an idea canvassed by the Henry Tax Review in 2010. Planning and zoning rules could also play a role.

Other policy design decisions could have other effects on prices. Our modelling is based on an immediate swap of stamp duty for land tax.

This is not the same as the NSW government’s opt-in proposal, which could have different price consequences to the policy we modelled.

The NSW government is also reported to be considering excluding the most expensive 20% of properties from the switchover, so it can continue to collect stamp duties on high-value transfers.

In future work we plan to extend our modelling beyond a simple swap of stamp duty and land tax.

This article was originally published on the Conversation. View it here…

Hybrid working post-COVID: how young professionals can optimise their time in the office (and why they should)

Gemma Dale is a lecturer in the Business School at Liverpool John Moores University and runs her own business ‘The Work Consultancy’, where she focuses on HR policy development, flexible and hybrid working and wellbeing. Prior to joining LJMU, Gemma was a HR Director and worked in a variety of senior HR roles for over twenty years. Gemma was nominated in the Top 50 'Most Influential Thinkers in HR' list 2021.

During the pandemic, around 100 million people in Europe switched to working from home – nearly half of them for the first time. This shift was rapid, with employees quickly noticing the benefits of remote work. These can include freedom from commuting, more time for personal wellbeing and increased productivity.

As we move on from pandemic restrictions, we’ve seen a strong, global demand for more flexible forms of working, particularly to retain an element of remote work. While some employees want to work from home permanently, most want what’s coming to be regarded as the best of both worlds: hybrid working. Only a minority of workers now want to return to the office full time.

One group which may be particularly keen on hybrid working is young professionals. And for this group, time spent in the office could be especially valuable.

Young people and remote work

Surveys undertaken during the pandemic indicated that generation Z (those born after 1996) were more likely to say that they were struggling with work-life balance and post-work exhaustion than older generations.

There are several possible reasons for this. Younger people may find it more difficult to establish a good homeworking set up, depending on their living arrangements. Those early in their careers may have smaller professional networks, leading to greater isolation. Or they may simply have less experience managing the boundaries between work and life outside of work, which can be made more difficult when there’s no physical office to leave at the end of the day.

Despite this, emerging evidence suggests that younger workers want remote and flexible work rather than a return to the office full time. Surveys vary, but generally indicate that around two-thirds of members of generation Z working in office jobs want a hybrid working pattern in the future – and they’re prepared to move employers to find it.

According to a recent survey by management consulting company McKinsey, employees aged 18–34 were 59% more likely to say they would quit their current role to move to a job with flexible working compared with older employees aged 55–64.

It’s worth going into the office sometimes

Remote and hybrid working can bring many benefits. For employees, remote work provides the opportunity to reallocate costly and sometimes stressful commuting time into activities that support work-life balance and health. Indeed, more than three-quarters of hybrid and remote workers report improved work-life balance compared with when they worked in an office full time.

Meanwhile, hybrid work provides autonomy and choice for employees. They can combine time at home for focused and independent work with time in the office for collaboration and connection. A hybrid working model can be good for productivity, inclusion and motivation.

However, the belief that work is best done in an office environment is pervasive – and young people in particular are thought to need to go into the office to build professional networks and to learn.

There could be some truth to the idea that young people early in their careers uniquely benefit from going into the office. Research conducted prior to the pandemic has associated being out of sight while working remotely with also being out of mind. Notably, people who work exclusively at home are less likely to receive promotions and bonuses.

Conversely, being with colleagues in person has been associated with greater career advancement. In part, this is probably because being physically present in the office appears to signal commitment to the organisation.

Can hybrid work address the risks of fully remote work and preserve the rewards associated with face-to-face interactions in the office? Only time will tell.

Finding the right balance

Before 2020, remote work was still relatively rare. Hybrid working at scale is a new concept.

But throughout the pandemic, perceptions about working from home have improved globally. The latest UK data suggests nearly one-quarter of working adults are now hybrid. So in the future, we’ll need to understand more about the impact of remote work both on organisations and the people who undertake it.

The challenge for younger employees is to identify an effective working pattern that suits both them and their organisation – and supports their career goals. As tempting as it may be to ditch the commute as often as possible, younger employees may instead wish to consider a more strategic approach.

When in the office, they should focus on personal visibility, and building and maintaining relationships with colleagues and managers. Networking and learning must be the focus of working in-person, and wherever possible, online meetings or independent work should be saved for remote working time.

Combine this with good wellbeing practices when working from home, especially around switching off from work, and hybrid might just deliver on its promises of better work for everyone – young and not so young alike.

This article was originally published on the Conversation.

The housing game has changed – interest rate hikes hurt more than before

Brendan Coates is the Program Director at the Grattan Institute, where Joey Moloney is the senior associate. Previously Brendan has worked at the World Bank in Indonesia, and holds a Master’s of International Relations from ANU; while Joey achieved a bachelor of commerce with honours from the University of Melbourne.

The Reserve Bank has lifted the cash rate for the second time in two months, this time by 0.50 points to 0.85%.

It won’t be the last such hike. Forecasters expect the cash rate to hit 2.5% by the end of next year. This would lift the typical variable mortgage rate to near 5%.

Cue the claims that the new generation of borrowers are entitled – they don’t know how good they’ve had it with such low rates.

But the refrain misses the full story. High house prices have changed the game, making it much harder for today’s borrowers

It is true that even a mortgage rate of 5% is well below the peak of about 17% earlier generations paid at the start of the 1990s.

But the impact of those high rates on overall mortgage interest payments as a share of income was modest, because house prices were much lower then, and mortgages were much smaller.

Typical house prices used to be about four times incomes. Now they’re more than eight times incomes, and more in Melbourne and Sydney.

This has meant that for any given mortgage rate, the share of income taken up by mortgage payments is much, much higher.

If you have a small loan with a high rate, all you need is a cut in rates, some inflation and decent income growth, and your mortgage burden can fall sharply.

That’s how it was for borrowers in the 1990s. High rates stung, but not for long.

Borrowers in the 1990s who started out devoting more than 30% of their income to paying off a mortgage found themselves devoting just 12% by the time the loan was halfway through.

It’s different if you’ve borrowed recently.

If you’ve taken out a big loan at today’s ultra-low interest rates, there’s only one way your mortgage payments can go – and that’s up.

5% would hurt like it didn’t used to

Even if mortgage rates stabilise at around 5% – which is implied by some of the things the Reserve Bank governor has said – and wages grow faster than they have for a decade, the mortgage burdens of millennials who’ve bought houses recently won’t much decline.

The extraordinary increase in house prices and debt means mortgage rates of 7% would be as painful to borrowers today as rates of 17% were decades ago.

It’s a common barb that newer generations are struggling with home ownership and housing costs because of profligate spending, on smashed avos and the like.

But millennials spend less of their incomes on “discretionary” items – such as alcohol, clothes and household services – than people of the same age did decades ago.

What millennials are spending much more on is housing, simply because houses are so much more expensive.

So as the Reserve Bank continues to increase rates, it’s important to keep in mind that comparisons between then and now miss the full story.

Skyrocketing house prices have changed the game. For millennials, even historically small increases in interest rates will hurt.

This article was originally published on the Conversation on 7th of June 2022. Read it here.

Australia’s cities policies are seriously inadequate for tackling the climate crisis

Anna Hurlimann and her co-authors are professors and researchers in the Urban Planning department at the University of Melbourne. All five contributing authors are esteemed panel members of Australian planning institutes, and receive funding for research accordingly.

It will be impossible to tackle climate change unless we transform the way we build and plan cities, which are responsible for a staggering 70% of global emissions. Yet, Australia’s national policies on urban environments are seriously inadequate.

For our ongoing research, we have interviewed more than 140 built environment professionals – architects, urban planners, property developers and more – about their experiences of barriers to climate change action.

They said Australia’s policies, or lack thereof, prevent the necessary action to not only address cities’ contribution to climate change, but also to protect cities from its impacts. As one urban planner told us, “there’s just no appetite for it” in federal government.

The incoming government must strengthen urban development policies if we’re to have any hope of meeting Australia’s net-zero emissions by 2050 target. This requires integrated action across built environment sectors.

Cities in a changing climate

Two types of climate change action are urgently needed in cities:

  1. mitigation: reducing greenhouse gas emissions, including from manufacturing and construction materials, and from the energy used to operate buildings, amenities and infrastructure

  2. adaptation: ensuring cities can endure climate change impacts such as increased bushfires, rising sea levels, drought, heatwaves and other severe weather events.

Cities are associated with most of humanity’s consumption of natural resources, such as coal and gas for energy use, and coal and iron to make steel. This means cities release enormous amounts of emissions.

Take the carbon footprint of Greater Melbourne, as an example. Melbourne released an estimated 100 million tonnes of carbon dioxide equivalent in 2009, or 25.1 tonnes per person. Of these, 4.5 tonnes are from construction and real estate services; the second highest contribution.

Materials such as steel, concrete, aluminium and glass are abundant in city infrastructure, and their production releases significant emissions.

The City of Melbourne has a stock of 1.5 million tonnes of materials per square kilometre. If we built the city today, construction alone would result in 605,000 tonnes of emissions per square kilometre. It would also use 10 petajoules of energy – the same as 700,000 cars driving from Melbourne to Sydney.

The construction industry requires better legislative drivers, including building codes, that encourage the use of recycled materials to reduce emissions.

Cities also bear a high cost of climate change impacts, particularly heatwaves and floods.

During heatwaves, cities can be up to 12 degrees hotter than surrounding rural areas.

Cities are also prone to flash flooding, as the high proportion of sealed surfaces such as concrete in urban areas can’t soak up water when it rains, like soil can. This makes them vulnerable to storm damage.


Barriers to climate action

Over the last five years, we’ve conducted in-depth interviews with 140 professionals working across built environment sectors.

They identified a number of key barriers to effective climate mitigation and adaptation in cities, such as a dearth of urban development policy addressing climate change, particularly at the federal level.

They also identified a lack of government leadership, and financial constraints in the fiercely competitive property and development environment. An urban planner said: We don’t even have a strategy for settlement in this country, let alone […] an urban development strategy. So, that’s where a lot of our climate change issues arise from: our cities and our urbanisation.

A federal urban policy agenda, if well designed and implemented, could help coordinate and fund urban development activities, providing leadership which industry would follow.

For example, it could determine where infrastructure (such as transport), services (such as hospitals), and housing are needed, and provide incentives for their sustainable construction.

Another barrier to effective climate action our interviewees identified was the tensions between local, state and federal governments, and the uncertainty about which level of government is responsible for taking action, including responding to disasters.

We saw this uncertainty most recently during the recent floods in New South Wales and Queensland, when there were delays in allocating emergency funds and assistance to people in need.

A property professional told us: Climate change action needs to be driven by all governments, federal, state and local – it has to create a level playing field. The property industry and its developers will not try any [climate] action unless they think it will differentiate them and they would make money out of it.

What will happen to homes?

Decades of climate change knowledge are presently poorly translated into built environment policy. As the planet continues to warm, this will have dire consequences on Australia’s most populated areas, such as exacerbating inequities.

In some at-risk locations – such as towns built on floodplains or in bushfire-prone areas – local governments will have to manage increasing climate change impacts on declining budgets, as property values and revenue from council rates decline.

Properties that can’t adapt to climate change, or for which the cost to adapt is prohibitive, will be unable to gain insurance. A recent analysis by the Climate Council found climate change impacts, particularly flooding, will make 1 in 25 Australian properties uninsurable by 2030.

This will reduce their value. Houses in areas prone to flooding or sea level rise have been found to be in a worse state of maintenance and repair. This compromises residents’ health and safety.

The people worst hit by climate change impacts will be disadvantaged populations living in areas where property is cheap, and these groups will find it hardest to recover when disaster strikes.

So what needs to change?

Thanks to our interviews, we can identify a few ways to help address climate change action in cities. This includes:

  • federal regulation of the built environment to boost climate change mitigation and adaptation, such as by strengthening the construction code

  • ambitious emissions reduction targets consistent with international goals, and translated into action across urban sectors

  • greater resources, such as funding and professional development opportunities, to support action

Our interviewees also identified the need for stronger leadership, more policy certainty and more cohesive collaboration across all levels of government.

What might this look like in practice?

Regulating land use with urban density and connectivity in mind would see homes, workplaces and services like hospitals easy to get to by walking, cycling or public transport. Likewise, improving building codes and design regulations would see buildings with less reliance on air conditioning or heating.

The incoming government should do everything possible to ensure we live a world that doesn’t exceed a temperature rise of 1.5℃ of warming this century. This cannot happen without stronger national policies on the built environment.

This article was originally published on the Conversation. Read it here…

Construction Tender Pricing in a Volatile Market

Arif Uzay joined Rider Levett Bucknall in 2002 as a cadet quantity surveyor, promoted to an associate in 2010 and in 2017 was appointed as a director. He is passionate about the built environment, diversity and inclusion within the construction industry, and contributing to change. Arif also demonstrates a comprehensive understanding of financial and cost management, specialising in conceptual estimating, cost planning, construction services and project procurement. He has considerable experience providing services for both the Government and the private sector on a broad range of construction projects and industries.

The construction industry directly employs almost 1 in 10 Australians across approximately 400,000 businesses. It generates over $360 billion in revenue annually, making it responsible for around 9% of Australia’s Gross Domestic Product. According to data published by the Australian Industry and Skills Commission in January 2022, this revenue is projected to grow by 2.4% in the next five years. Clearly, the construction industry is a significant contributor to Australia’s economy.

However, the industry is set to face an increasingly challenging environment. All RLB offices are predicting market pricing volatility due to supply chain instability, rising shipping costs, changing labour dynamics and increasing material costs.

Remarkable Resilience

Prior to the outbreak of the COVID-19 pandemic, the construction industry was expecting relatively stable volumes of work over 2020, 2021 and into 2022. Analysts were predicting a slight drop in activity in the major centres after the record levels of construction during 2018 and 2019. Escalation was following the Consumer Price Index (CPI) pattern of relative stability in all major cities, with only minor activity fluctuations. 

Since the outbreak of the COVID-19 pandemic, the construction industry has shown remarkable resilience. This is partly because the industry was classified as ‘essential’ by state governments. For the most part, this classification created a stable working environment, enabling the completion of existing projects, and the commencement of new projects.

The total value of approvals in Australia rose by 16.3% ($28 billion) for the 2021 financial year (FY 21) compared to the 2020 financial year (FY 20). Significant upturns (above 15%) were seen in approval levels in all states except Victoria (up 2.5%). For the seven months to January 2022, approval levels were 9.4% higher than the corresponding period in 2021. 

In the first quarter of 2022, 95 cranes were added to Australia’s skyline, taking the total to 813 cranes across the nation. This is the highest number of cranes recorded since the inception of the RLB Crane Index in 2012.

Forecasts for 2022 indicate that the construction industry is in a positive phase. It is likely that volumes of work will increase in the coming years, with significant construction activity in road, rail, health and social and affordable housing projects.  

An Increasingly Challenging Operating Environment

Despite this positive activity, the first quarter of 2022 has given rise to an increasingly challenging operating environment. Several factors are expected to affect the construction industry over the short, medium and long term, all of which have the potential to greatly impact cost, time and availability of resources. However, the quantum cannot yet be determined. 

Supply Chain Issues

Fragmented supply chain issues are still not resolved. The lead time for some international products is traditionally 8 to 10 weeks. It is currently 16 to 20 weeks, and in many cases longer. Stunning satellite footage released in April reveals the extent of the global shipping backlog, with thousands of ships moored offshore near Shanghai’s port.

Labour Shortages

Construction job vacancies have increased by a massive 80% since late 2019. And, according to Infrastructure Australia’s latest projections, by mid-2023, employment will need to grow from 183,000 people to more than 288,000. The potential shortfall in jobs is forecast to exceed 105,000 people, with one in three jobs advertised going unfilled. This shortfall is across all occupations, from engineers and project managers, to skilled tradesmen. Skills demand is 48% higher than supply.

As a result, contractor and subcontractor resources are stretched to the limit. This is making contractors and subcontractors much more selective in their tenders and causing project delays. It could also lead to increased wage pressures. The slow reopening of Australia's borders may offset some of these labour shortages, if skilled migrant numbers increase. 

State and Federal Elections

The 2022 federal election, and state elections in Victoria and South Australia, will impact public sector investment, albeit at the long term cost of ever increasing account deficits. However, it is expected that all governments will continue to support the economy by investing in infrastructure. 

Interest Rate Rises

In response to the highest inflation readings in nearly 40 years, the Reserve Bank of Australia lifted interest rates by 25 basis points in May. It has been tipped that this could increase to as much as 40 basis points by June. The interest rate rise is likely to quench the overly heated domestic housing market to some degree, with household borrowing power reduced. It could also impact contractors and subcontractors, affecting the cost of materials, cashflow and business borrowing power.

Global Geopolitical Escalations

The conflict in the Ukraine is generating flow on effects such as higher fuel prices, potential timber shortages due to unstable imports from Baltic nations, and a generally very unsettled geopolitical landscape. It is too early to determine the long-term impacts of the conflict. However, it is clear that these impacts are likely to linger for some time yet. 

In addition, the zero COVID-19 policy and its associated lockdowns adopted in China are impacting factory production and global supply chains. 

Natural Disasters

The economic cost of the flood damage on the eastern seaboard is yet to be fully understood, with forecasters predicting more rain in already saturated areas. Pressure will be seen in the need for additional materials, plant and labour for the rebuilding efforts within communities across New South Wales and Queensland.  

The Effect on Tender Pricing 

Pressure on tender pricing continues across Australia. There have been material price increases for cement, steel, PVC based products, timber, joinery, reinforcement and other metal based products. Some commentators suggest that building material costs in aggregate are up 20.4% over the last year, and 31.3% since January 2020. And, these prices are expected to rise throughout 2022. 

This has prompted some trades to specify supply rates as a condition of tender pricing, resulting in a price adjustment should supply rates increase. Similarly, hold prices from some steel suppliers have diminished, with increases of 20% observed since October 2020. In Victoria, tender validities are being qualified at 30/60 days versus 90/120 days.

Significant surges in tender pricing have been experienced in Queensland and Perth where escalation uplifts for 2021 and 2022 are well above levels forecast at June 2021. Across the other states, it is a similar story, with levels also above those forecast six months ago.

As expected, these market conditions are flowing through into subcontractors. Head contractors have reported volatile pricing from the subcontract market, difficulty in pinning down pricing and subcontractors being selective in providing tenders. This is because the subcontractors are at capacity or unable to secure labour should their workloads increase. 

Note: RLB’s Tender price Index uplifts for Q2 2022 and the remainder of 2022 are presently being revised and will be made available in the Rider Levett Bucknall Q2 2022 International Report that will be published mid-June 2022. The publication will be available from the Insights dropdown on the www.rlb.com website 

Conclusion

Looking ahead, all RLB offices are predicting continued market pricing volatility due to the factors identified above. The quantum of construction escalation for the foreseeable future is very difficult to calculate as all factors influencing construction pricing is dynamic at present, and changing constantly. RLB is not alone in this conundrum. The global construction community is experiencing similar influences we are seeing in Australia, instability in supply chains, changing labour conditions and increasing material costs, all key factors in forecasting construction cost movement.

Asia Pacific real estate investment surges 20% in Q1 2022

JLL is a leading professional services firm that specializes in real estate and investment management.


Activity strongest in Singapore, South Korea and Australia

Investment growth in the Asia Pacific real estate sector continued in the first quarter of 2022 with volumes up 20% year-on-year. According to data and analysis published in the JLL Capital Tracker Q1 2022, $40.8 billion of capital was deployed via direct real estate investment into the region throughout the quarter. Increases in investment volumes were most pronounced in Singapore, South Korea, and Australia. Sector wise, retail and office performed strongly whilst logistics and industrial reported a moderated growth rise of 3.5% year-on-year.

“Investors continue to diversify when deploying capital across Asia Pacific, represented by a swing of investments into retail assets, continued support for the office market, and high growth in Singapore, Korea and Australia allocations. We are optimistic that the region’s real estate sector will withstand rising interest rates and growing uncertainty. We are still seeing intense competition for assets and maintain our projection of over $200 billion in direct investment into Asia Pacific for 2022,” says Stuart Crow, CEO, Capital Markets, Asia Pacific, JLL.

Singapore commercial real estate recorded the largest investment growth trajectory in the region, up 134% year-on-year to finish the first quarter with $5.7 billion in investments, driven by large transactions in the office and retail space. South Korea continued to perform in the first quarter, growing 89% year-on-year to $8.2 billion on the back of diversified investments across office, retail and logistics and industrial sectors. Australia posted the third largest annual investment growth (up 49%) as investors deployed $4.7 billion of capital into the market, with a focus on office. Japan remained the region’s largest investment market ($8.5 billion) despite a year-on-year decline of 26%. China remained flat in the first quarter with volumes totaling $8.3 billion.

The Asia Pacific retail sector registered the largest growth in the first quarter of 2022 with investments rising by 39% year-on-year. Over $8.0 billion in capital was deployed into retail assets throughout the quarter as foot traffic returned after loosening of pandemic management policies in most markets. Driven by attractive yields and diversification of portfolios, investors demonstrated renewed confidence in retail space through transactions including Tanglin Shopping Centre ($642 million) in Singapore, Seongsoo E-mart (US$552 million) in Korea, and Casuarina Square (US$288 million) in Australia.

Office remained the most popular sector in Asia Pacific measured by total volume, growing by 9% year-on-year to end the first quarter with $17.3 billion in direct investment. Buoyed by improved net absorption and rental growth, investors remained bullish on the region’s office sector, with notable deals including AlphaDom City Alpharium Tower (US$846 million) in Korea, Cross Street Exchange ($600 million) in Singapore, and Darling Quarter ($453 million for 50% stake) in Australia, reflecting sentiment.

Activity in the logistics and industrial sector rose 3.5% year-on-year but the pace of growth moderated with the sector only managing to garner $8.3 billion in capital deployed in the first quarter. The absence of large portfolio deals and limited deal pipelines contributed to slower investment growth in the sector, despite broad interest from investors. Notable transactions included the sale of the DLJ Greater Shanghai Portfolio (USD $717 million) in China.

Hotel transactions remained resilient, reaching $3.1 billion as more hotels changed hands with investors attempting to buy at bargain or to convert underperforming hotels into living product. JLL expects the sector to rebound further in 2022, forecasting $10.7 billion transactions for the full year, up 15% on 2021.

“Investors are sitting on over $50 billion in dry powder and have demonstrated in the first quarter their confidence in spreading capital across geography and sector. In the coming months, momentum will shift towards logistics and industrial as supply comes to market, and funds will increasingly focus on income resilient sectors,” says Pamela Ambler, Head of Investor Intelligence and Strategy, Asia Pacific, JLL.

Learn more here.

This article was originally published by JLL here.

Tiny and alternate houses can help ease Australia’s rental affordability crisis

Heather Shearer is a research fellow at Griffith University, primarily concerning urban sustainability, including housing affordability, water and energy use, environmental behaviour and attitudes to climate change. Heather has a PhD, which investigated household response to water demand policy; a Masters in Environmental Management and BA (Hons) in Environmental Science.

Rental housing in Australia is less affordable than ever before. It is no exaggeration to call the situation a crisis, with vacancy rates at record lows.

But there are some relatively simple, easy-to-implement and cost-effective things that can be done to ease rental affordability pressures.

These include relaxing planning restrictions on small and non-traditional houses, allowing granny flats to be rented to anyone, permitting property owners to let space to tiny house dwellers, and possibly even subsidising the building of granny flats or modification of houses for dual occupancy.

‘Dependant’ persons only

The degree to which local councils permit very small dwellings depends on factors such as dwelling type, lot characteristics, planning scheme zoning and overlays, and state regulations.

Subject to these constraints, granny flats are generally legal in Australia, though states such as Queensland and Victoria restrict who can live in them.

In Queensland, most councils limit occupancy to members of the same household, defined as a group who “live together on a long-term basis and make common provision for food or other essentials for living”.

In Victoria, granny flats can only “provide accommodation for a person who is dependant on a resident of the existing dwelling” (and are hence called Dependant Person’s Units).

While these laws are sometimes ignored, they limit the potential for this affordable housing option for other individuals who struggle in the housing market. Extra council regulations and fees also make building a granny flat complicated, time-consuming and expensive, particularly if they incur infrastructure charges.

Desperately seeking parking space

Tiny houses, especially those on wheels, are typically not approved for permanent residence. Councils consider them caravans, with periods of permitted occupancy ranging from zero to about three months.

Some councils will tolerate them but, if receiving a complaint, can demand the tiny house be removed at short notice.

This can cause extreme distress. Some tiny house owners report living in constant fear of being moved on. In recent years we’ve seen increasing numbers of posts on tiny house social media pages pleading for “parking space”.

Because of these barriers, most tiny houses in Australia aren’t in urban areas, where demand for rental properties is highest, but hidden “under the radar” in more rural areas.

These areas typically have poorer access to public transport, employment, education and health services. If unknown to authorities, tiny house dwellers may also be at higher risk from natural disasters such as bushfires and floods.

Benefits from easing restrictions

Removing some restrictions on letting granny flats and permitting and regulating longer-term occupancy for tiny house dwellers can help ease these rental affordability challenges.

There are other benefits too. For local councils trying to limit unsustainable, low-density expansion on their fringes, these changes enable a relatively gentle and unobtrusive form of densification in places where resistance to change is common.

It could also support more ageing in place (enabling the elderly to downsize while staying in their neighbourhood), reduce development pressures on the natural environment, and provide valuable income both for home owners and give local councils a new stream of rate income.

Allowing property owners to let space to a tiny-house dweller (with appropriate regulations on aesthetic appearance, safety features and environmental impacts) could be a cost-effective and rapid way to increase rental supply for some demographics. Single women over 50, for example, are at high risk of homelessness and also the demographic most interested in tiny house living.


This crisis needs innovative responses

We have seen that, when disasters strike, governments can introduce innovative responses to local housing crises.

In response to the massive floods of February and March, the New South Wales government’s Temporary Accommodation Policy changed the rules to allow a moveable dwelling or manufactured home to be placed in a disaster-affected area for up to two years, or longer subject to council approval.

Allowing tiny houses for a trial period of, say, two years could provide a valuable pilot project, and perhaps alleviate the concerns of some local ratepayers. In nine years of research into the tiny house movement in Australia, we have found some councils are willing to consider permitting tiny houses – but only if another council does it first.

A longer-term solution is to encourage the building of more granny flats as part of a program of moderate densification, as is happening in Auckland, New Zealand.

Rather than subsidising expensive renovations of existing homes – as the Morrison government did with its HomeBuilder grants scheme – federal, state and territory governments could offer incentives to divide or extend homes in well-designed and sustainably constructed ways to enable dual living.

While not as visibly dramatic as floods and bushfires, the crisis of housing affordability deserves equally imaginative policy responses. After all, adequate housing is enshrined in the UN’s Universal Declaration of Human Rights.

The crisis is complex and multifaceted. There are no easy solutions to address it in its entirety, and for every demographic. Tiny houses and granny flats are not suitable for all households. But business as usual is no solution.

We need a willingness to experiment with and learn from innovative and even disruptive approaches.

This article was originally published on The Conversation. Access it here…

The Big Housing Problem - Opinion

Ken Morrison is the Chief Executive of the Property Council of Australia. He is also a director of the Green Building Council of Australia, a director of the Australian Sustainable Built Environment Council, a member of the National Affordable Housing Alliance and is a Property Champion of Change working to achieve a significant and sustainable increase in the number of women in leadership roles.

Housing affordability is now firmly on the federal election agenda. This is a great thing.

Because there’s every reason that Australia should be having a red hot debate on housing affordability and what should be done about it.

A recent survey conducted for the Property Council found over 70 per cent of voters believe that younger people will never be able to purchase a home in our country. Almost 90 per cent of people trying to get into the market say housing affordability is one of the most important issues in deciding their vote. 

We’ve known for a long time that Australian house prices are high by international standards. International housing affordability survey Demographia ranks all Australian capital cities bar Darwin as ‘severely unaffordable’.

Last week we also saw more evidence that housing costs and rents are feeding into higher inflation in unhelpful ways.

Australia desperately needs better policy frameworks which provide the housing supply and choice that our growing communities need.

The current Federal Government has delivered some very important housing measures over its term. During the depths of the pandemic the Government’s HomeBuilder program helped avert a construction and jobs calamity, keeping hundreds of thousands people in work and the economy moving. 

The Government’s Home Guarantee Scheme – extended in the budget and supported in a similar form by Labor – has helped first home buyers and others bridge the deposit gap.

The Opposition’s proposed Help to Buy shared equity scheme announced on Sunday would also make a big difference to the 10,000 people a year who could secure a place in the program.

These and other existing schemes are worthy, targeted and welcome – but by themselves they don’t represent the systemic overhaul the nation needs.

And that’s why the second part of Labor’s housing announcement at its campaign launch is particularly important. Labor’s proposal to establish a National Housing Supply and Affordability Council got less attention, but it presents far greater potential for real reform.

The Government’s official forecasts from the National Housing Finance Investment Corporation show a housing supply crunch is on the horizon. 

The numbers show housing supply is set to fall by fully one third, right at the time our population growth is returning to normal settings. NHFIC estimates that between 2025 and 2032 Australia will find itself 163,400 homes short of demand.

Falling supply and rising demand is a danger zone for housing affordability. 

State, local and federal taxes and charges can already make up almost 40 per cent of the cost of a new home, and poor supply and planning systems add further upward pressure on the cost of supplying new homes for a growing nation.

So a focus on housing supply is the right one. Yet any new Housing Supply and Affordability Council also needs real teeth. It’s one thing to set out housing targets for each state and territory, it’s another to ensure these targets are met. It’s the hardest part, yet the most crucial.

What will be needed is a set of carrots and sticks within a joined-up national plan that ensures these goals are achieved. All three tiers of government must be prepared to work together on this. Pleasingly, a recent Parliamentary inquiry led by Liberal MP Jason Falinski set out several workable models that could see the federal government take a leadership role in helping to incentivise better outcomes at state and local levels.

In fact, the words ‘models’, ‘outcomes’ and ‘supply’ seem almost hollow, or policy-wonkish when you consider the humanness of the issue we face.

When we talk about ‘outcomes’ we’re talking about quality of life. When we talk about ‘supply’ we’re talking about choice: Giving grandparents the chance to find a suitable home, in the same area where their children are now raising their own families. Giving teachers and nurses the opportunity to afford to live near where they work, the same community they tirelessly serve, rather than living far away and battling long commutes. At the end of the day housing supply is about keeping families close, and communities connected.

And while we know delivering greater housing supply and choice is vital for affordability, it is also critical for the economy. 

In 2015 the Productivity Commission said that better functioning cities and towns was one of the top five productivity opportunities for the nation. The Commission particular took aim at the overly complex and inefficient state planning and zoning systems around the country. 

On top of that Shifting the Dial report, there have been 13 separate federal parliamentary inquiries and reports on the subject of housing affordability since 2003… with no real dial being shifted.

It has taken several decades to undermine the great Australian dream of owning your own home. 

Solving these issues won’t happen overnight and will take gumption and collaboration from all levels of government.

With only weeks until the May election, the property industry is ready and willing to help governments tackle this BBQ-stopper head on.

Undecided voters are ready for action too.

This article was written by Ken Morrison, and was originally published on the Daily Telegraph on 03/05/22.

Flexibility makes us happier, with 3 clear trends emerging in post-pandemic hybrid work

Professor Anne Bardoel, is the Course Director for the Master of Human Resource Management at Swinburne Business School. Anne has published articles in high ranking academic journals such as Human Resource Management, International Journal of Human Resource Management, and Sociology.

The first national study of working arrangements in Australia since government work-from-home directions were lifted shows post-pandemic office life is going to be dramatically different to what existed before.

Our survey of 1,421 knowledge workers – essentially anyone doing computer-based work able to be done remotely at least some of the time – was conducted in the week of 21-25 March 2022.

It shows fewer than a quarter of workers (about 23%) returning to commuting five days a week, with about the same percentage working remotely full-time.

About 44% were doing “hybrid work”, splitting their week between days in the office and working remotely. These workers were split fairly evenly between three emerging models of hybrid work.

Who we asked, and what we found

Our survey asked participants a total of 46 questions, covering their current work arrangements, ideal work arrangements, health and well-being, workplace culture, skills changes and communication technologies, along with demographic information (age, sex, income etc).

The survey sample was nationally representative of state and age populations, though slightly skewed towards male participants (58% male vs 42% female).

The following chart shows working arrangements at the time of the survey.

The “other” category includes hybrid variations such as a mixing fixed and flexible days (for example, having one fixed day in the office and two days of the worker’s choice) as well as unspecified arrangements.

Including this category, our results show a majority (54%) following a hybrid work model, with 23% still working remotely full-time and 22.9% back in the office full-time.

By comparison, just 28% of Australian knowledge workers had the chance to work remotely for any part of the week prior to the pandemic.

3 main types of home and office arrangements

Our main motivation for this study was to better understand how new work arrangements are being designed and implemented in what the Productivity Commission has described as the second wave of work experimentation – following the first wave of working from home enforced by COVID-19.

Our survey shows no clear “winner” between the three broad approaches to hybrid work:

  • Days in office fixed, with workers expected to attend the office for a specific number of set days (e.g. Tuesdays, Wednesdays and Thursdays). This applied to 29% of hybrid workers (and 15.6% of all respondents).

  • Fixed office frequency, but workers have the flexibility to choose which days (i.e. any three days a week). This applied to 24.3% of hybrid workers (and 13.1% of all respondents).

  • Flexibility to choose where they work and when. This was the case for 28.5% of hybrid workers (and 15.4% of all survey respondents).

Happier with autonomy

From the individual perspective, our survey strongly indicates those with the greatest flexibility were happiest.

We asked participants to indicate how happy they are with their current work arrangements on a five-point scale from “very unhappy” to “very happy”.

About 94% of those with the greatest flexibility said they were happy or very happy with this arrangement. This compares with 88.5% of those working remotely full-time, and 70.6% for those going into the office full-time.

When asked to choose their ideal work arrangements, the most popular choices were having control over the location where they work and when (23.0%), followed by working remotely full-time (22.8%).

Better health and well-being

In good news for employee health, one third (30.2%) of workers said they now have a better work-life balance than they did two years ago, compared with less than one in ten (8.7%) who think it has worsened.

Over a quarter (27.4%) said the key benefit from having a better work-life balance was having more time to invest in their health and wellness.

As the Productivity Commission has noted, while the first wave of forced experiment broke down resistance towards flexible work practices, this wave of voluntary experimentation involves “negotiating, trialling and adjusting” to see what best works for individuals and organisations.

It is still very early days in the evolution of hybrid work, and organisations will no doubt have to experiment and test out a number of different arrangements before they find the ones that produce the best long-term results for them and their employees.

This article was originally published on the Conversation. Read it here…

The RBA has lost some patience on rates, but it isn’t rushing to push them up: here’s why

Dr Isaac Gross is a lecturer in economics at Monash University. He has a DPhil and a MPhil from Oxford University in Economics. From 2011 to 2013 he worked as an economist for the Reserve Bank of Australia.

It is coming up to 18 months since Australia’s Reserve Bank last cut its cash rate.

And what it did then was merely a further cut, from an unprecedented low of 0.25% to a fresh unprecedented low of 0.10%

Since it last changed the direction of rates (started cutting instead of hiking) it has been 10 years and five months.

Which is why it has been telling anyone who asked (and repeatedly using the phrase in its official communications) that it is “prepared to be patient” before changing again. It wants to be sure conditions necessitate such a move.

On Tuesday, in the statement released after the board’s April meeting, the words “prepared to be patient” were missing.

The board has literally lost its patience.

Instead of saying it was prepared to be patient “as it monitors how the various factors affecting inflation in Australia evolve”, it said

Over coming months, important additional evidence will be available to the board on both inflation and the evolution of labour costs.”

The clear message (and the words in Reserve Bank statements are chosen very carefully) is that if the bank doesn’t like what it sees on inflation and wage costs over the coming few months, it’ll jack up rates, for the first time in a decade.


Prices, and wages

So what is it waiting for?

The first is the March quarter inflation results which will be published by the Australian Bureau of Statistics in three weeks on April 27 during the middle of the election campaign.

Economists expect headline inflation to be quite high, up from the latest 3.5%

So-called underlying inflation, which filters out unusual price moves, and is what the Reserve Bank actually targets, might not climb as high.

But even if it does, there’s every chance it won’t overly alarm the bank.

This is because the first three months of March were filled with temporary, one-off external shocks to the economy such as the increase in petrol prices and price the impact on supply chains of lockdowns in major Chinese cities.

Conceivably these one-off effects could dissipate after a few months. We were already seeing petrol prices fall before last week’s cut in petrol excise.

Many related price increases might fade away shortly after they arrive, making an increase in rates to restrain prices unnecessary.

For inflation to be sustainably within its 2-3% target band the Reserve Bank says it wants to see an increase in wages growth as well.

Wages are one of the main business costs meaning it is unlikely we will see long-lasting higher price inflation until we have higher wage inflation.

This is why even though the board will have digested the inflation report by its next meeting on May 3 (just ahead of the election) it may well wait until June when it can see the latest wage figures as well.

How high, how soon

If the bank does start raising rates in June, where will it stop?

Market pricing currently predicts the cash rate will jump from 0.10% to 2% by the end of the year, and to more than 3% by next year. They imply an average of one rate hike at every Reserve Bank board meeting for the next 18 months.

This is probably an upper bound for what we can expect. Market economists (the people who advise traders) as opposed to market traders expect the bank to hike no more than a handful of times in the second half of this year.

While jobs growth is strong, with underemployment at its lowest in a decade and unemployment close to its lowest in five decades, the bank will be cautious about slowing the recovery before it delivers widespread higher wage growth.

This raises the question of why interest rates are tipped to remain so low when unemployment is approaching its lowest level in half a century.

It is partly because high household debt means any increase in rates will have a much larger impact on household budgets and spending than it would have.

Interest rates won’t stay close to zero forever. But it will be a long time before they are back to the high levels of 4%+ last seen when the bank began cutting in 2010.

This article was originally published on the Conversation. Read it here…

Our cities are making us fat and unhealthy – a ‘healthy location index’ can help us plan better

Dr. Matthew Hobbs is a Senior Lecturer in Public Health and is a Co-Director, while Lukas Marek is a researcher and lecturer in Spatial Data Science. Both Lukas and Matthew are based at the University of Canterbury.

As councils and central government consider what cities of the future will look like, a new tool has been developed to map how various features of where we live influence public health.

The Healthy Location Index (HLI) breaks down healthy and unhealthy elements in cities across New Zealand. It offers important lessons for how we plan and modify our cities to increase physical activity levels and tackle important issues such as obesity and mental health.

The obesogenic environment

New Zealand has one of the highest numbers of adults living with obesity in the world and the rates are not improving. Data from 2021 showed a substantial increase in both childhood and adult obesity from the previous year.

Obesity is a major public health concern that is estimated to be responsible for approximately 5% of all global deaths annually. The global economic impact of obesity is estimated at roughly US$2 trillion or 2.8% of global GDP.

Health issues like this are often thought of in terms of personal responsibility. However, this approach diverts focus away from health systems, governments and physical environments.

The global rise in obesity since 1980 has occurred too rapidly for genetic or biological factors to be its root cause. Instead, it may actually just be a normal response to environments that provide easy access to energy-dense, nutrient-poor foods and a range of unhealthy options that require us expending very little energy.

Think about it: maintaining good health in our current environment requires a lot of effort. Why? Because healthy choices are often more difficult than convenient ones, be that trying to avoid fast-food outlets or conveniently placed liqour stores, the lack of access to fresh fruit and vegetables, or deciding to cycle rather than drive the car.

This is known as an obesogenic environment and it needs to change.


The Healthy Location Index

This change begins with an understanding of how things currently stand, which is where the HLI comes in.

Data used in our index includes quantifying access to five “health-constraining” features: fast-food outlets, takeaway outlets, dairies and convenience stores, alcohol outlets and gaming venues.

We also quantify five “health-promoting” features: green spaces, blue spaces (accessible outdoor water environments), physical activity facilities, fruit and vegetable outlets, and supermarkets.

The index provides a rank for every neighbourhood in New Zealand based on access to these positive and negative features.

Out of New Zealand’s three major urban regions, Wellington shows highly accessible health-promoting and health-constraining environments, Auckland offers relatively balanced environments, and Christchurch shows a high proportion of people living in more health-constraining environments.

Environmental injustice

The bigger picture created by the HLI supports previous evidence highlighting a disproportionate number of features that constrain health, such as fast-food outlets and liqour stores in socioeconomically deprived areas.

Of particular concern in the most deprived areas, the distance to health-constraining features was half what it was in the the least deprived areas, highlighting the persistent over-provision of gambling outlets and liqour stores in some parts of the country.

This phenomenon is well known as a form of “environmental injustice” which ultimately stems from a lack of equity in the development, implementation and enforcement of environmental laws, regulations and policies.

The index also highlights how areas of New Zealand with quick and easy access to health-constraining features are worse off in terms of both mental and physical health outcomes such as depression and type II diabetes.

While the index shows clear evidence that, on average, the most deprived areas of New Zealand often have access to health-constraining features, this finding is not universal. It also varies from place to place.

Wellington and Christchurch both have a decreasing number of health-promoting environments, with growing deprivation. However, there are remarkably more health-constraining places in Christchurch than in Wellington.

Knowledge offers a way to change

This is only our first iteration of the index and we intend to add more features in the future. But we hope the data provided in the index can encourage important conversations to help us better understand how our cities are shaped.

We need to ask whether we really need that additional fast-food outlet or liquor store in the same neighbourhood. We hope the index can help policy makers consider how to shape more health-friendly cities by regulating or adding the right features.

After all, the protection and promotion of public health is a core responsibility of government and it should not be left to individuals, families or communities to create such changes.

This article was originally published on the Conversation. Read it here…

Why Australia’s Reserve Bank won’t hike interest rates just yet

Peter Martin is Business and Economy Editor of The Conversation and a Visiting Fellow at the Crawford School of Public Policy at the Australian National University. A former Commonwealth Treasury official, he has worked as Economics Correspondent for the ABC and as Economics Editor of The Age. He also co-presents The Economists on ABC Radio National.


The biggest question relating to the management of the economy right now has nothing to do with next week’s budget. It has everything to do with the Reserve Bank and the board meetings that will follow it.

The question facing the board – the biggest there is when it comes to how the next few years are going to play out – is whether to hike interest rates just because prices are climbing.

On the face of it, it seems like no question at all. It is widely believed that that’s what the Reserve Bank does, mechanically. When inflation climbs above 3% (it’s currently 3.5%) the board hikes interest rates to bring it back down to somewhere within the bank’s target band of 2-3%.

It’s what it did the last time inflation headed beyond its target zone in 2010.

But the inflation we’ve got this time is different, and failing to recognise that misreads the bank’s rationale for pushing up rates, and what it is likely to do.

Inflation, but not as we’ve known it

The Reserve Bank does indeed target an inflation rate of 2-3%. The target is set down in a formal agreement with the treasurer, renewed each time a new treasurer or governor takes office.

Just about the only tool the bank has to achieve its inflation target is interest rates. If inflation is below the target, it can cut interest rates to make finance easier in the hope the extra money will encourage us to spend more and push up prices.

If inflation is above the target, it can push up rates so it becomes harder to borrow and interest payments become more onerous, taking money out of the economy and giving us less to push up prices with.

Here’s how the bank itself puts it:

If the economy is growing very strongly, demand is very buoyant and that’s pushing up prices, we might need to raise interest rates to slow the economy, to get things back onto an even keel.

Note the qualifier: “if demand is very buoyant and that’s pushing up prices”.

Buoyant demand (spending) is most certainly not the main thing pushing up prices now. The main things are beyond the Reserve Bank’s power to control.

Petrol prices have skyrocketed because of an invasion half a world away. It’s also the reason the global prices of wheat, barley and sunflower oil are climbing.

Food processors such as SPC say higher oil and food prices combined threaten to push up the price of a can of baked beans more than 20%.

The price of a set of tyres is set to climb from A$500 to $750 because tyres are made from oil.

Everything that is shipped and trucked using oil is set to cost more.

And trucks and cars themselves are climbing in price because of a global shortage of computer chips.

And it might get worse. Last week China locked down the high tech hub of Shenzhen, said to be the source of 90% of the world’s electronic goods, among them televisions, air conditioning units and smartphones. It reopened the city this week after testing its 17.5 million residents for COVID.

It’s easy to see why prices have shot up, and easy to see why they might not come down for a while. What is harder to see is how pushing up interest rates to crimp demand, to force Australians to spend less, would do anything to stop it.

What’s missing is inflation psychology

It’s a view Reserve Bank Governor Philip Lowe seems to endorse. He said this month that what he is on the lookout for is “inflation psychology” – the view that price rises will lead to wage rises, which will lead to price rises in an upward spiral.

It used to be how things worked. Australians who are old enough will remember when, if they saw something at a price they liked, they rushed out to buy it before it climbed in price. Australians born more recently have learnt not to bother.


The old psychology could come back, but wages growth – which would have to be high if that sort of thing was to happen – has remained historically low at 2.3%, little more than it was before COVID.

When surveyed, trade union officials expect little more (2.4%) in the year ahead.

It is true that these days most Australians aren’t in trade unions. So the Reserve Bank seeks out the views of ordinary households. On average, those surveyed expect wage growth in the year ahead of just 0.8%, which is next to nothing. The psychology hasn’t taken hold.

Until it does, it is best to think about most of what has happened as a series of isolated externally-driven price rises that have dented our standard of living.

Pushing up interest rates to dent living standards further won’t stop them.

The Reserve Bank is right to be on the lookout for internally-driven, self-sustaining inflation. We will know it when we see it – but we’re not seeing it yet.

Asked on ABC’s 7.30 this week whether there was a role for higher interest rates in an oil crisis, a former Reserve Bank board member, Warwick McKibbon, said

the worst thing a central bank can do in a supply shock or an oil crisis is to target inflation, because by targeting inflation you push downward pressure on the real economy

He went on to say that if the bank did it without success and then kept doing it, it would bring on a recession. I am sure the bank doesn’t want to do that.

Urban makers: why the city of the future needs to be productive

Johannes Novy is a Senior Lecturer in Urban Planning, School of Architecture and Cities at the University of Westminster. He has published widely on urban development politics as well as urban tourism and leisure consumption. He is a founding member of the Sustainable Metropolitan Tourismus Network (SMeT-NET) based at University of Westminster and Paris 1 Sorbonne-Pantheon as well as a member of the Berlin-based urbanist collective u-Lab, Studio für Stadt und Raumprozesse.


How can a city be socially just, environmentally sustainable and economically robust? And what role can urban industry play? These questions underpin IBA27, an ambitious international building exhibition to be held in the Stuttgart region of Germany in 2027. Ahead of that final showcase stage, designers from all over the world are taking part in multiple planning and architectural projects.

In March 2021, the Frankfurt-based architectural practice, JOTT took first place in one of these projects, a competition to design a new neighbourhood in the town of Winnenden, south Germany. Participants were tasked with drawing up plans for what the organisers termed a productive urban quarter.

When completed, visitors to JOTT’s new district will find no cars. Instead there will be an array of work spaces – industrial warehouses, a craftsman’s yard and workshops, offices, shared working spaces, laboratories and studios – built into seven mixed-use, high-density blocks with inner courtyards. Around these will be woven public squares, meadows and playgrounds. The plans also include a childcare facility, retail and leisure uses, flats on upper floors and space for urban agriculture on the roofs of buildings. The whole idea is that people who make things for a living should be able to live and thrive there.

The European Union’s key policy document for sustainable urban development, the New Leipzig Charter, advocates precisely for this kind of city: the productive city. It aims to enable and promote new forms of mixed-use development, that go beyond, say, adding a retail shop at the foot of a block of flats.

Research suggests that manufacturing plays an important role in helping urban economies to thrive. For urban planners, accommodating makers – from small-scale specialty food producers to startup tech entrepreneurs – is increasingly important.

Urban manufacturing

Manufacturing in an urban context has been shown to provide comparatively secure and well-paid jobs. It is important in achieving net-zero carbon targets and transitioning to urban circular economies. It reduces delivery kilometres, promotes the use of more sustainable delivery vehicles such as cargo bikes and encourages local repair and reuse centres to be developed. And, research shows, it makes urban spaces more interesting. Because most city dwellers no longer produce things for a living, many seem to relish the opportunity to see how others do it.

Companies have been quick to latch on. Guinness, for example, recently announced plans to open a brewery in central London near Covent Garden, bringing brewing back to an area where beer was first made 300 years ago.

New developments in cities across the globe, from Rotterdam’s mixed-use Makers District to the Makerhoods in Newark, US, echo this trend. It is fuelled by several factors. New production methods such as 3D printing, have made production less polluting and disruptive. Much manufacturing has also moved away from large-scale production, heavy machinery and massive infrastructure towards smaller, bespoke companies. This makes it easier to reintegrate industry into the urban fabric.

Further, a new generation of urban makers buoyed by the potential of online platforms such as Etsy to sell their wares, has revamped the image of the sector. Consumers, meanwhile, increasingly want local craftsmanship and sustainable, customised products.

Modernist shift

While most cities have been mixed use throughout their history, things changed at the beginning of the 20th century. Modernist urban planning sought to make cities more efficient, rational and hygienic. Concepts including functional segregation and single-use zoning became standard planning doctrines. As a result, most manufacturers were relocated to industrial parks on the outskirts of cities.

If 1960s urbanists came to value diversity in cities as an asset, industry nonetheless continued, quite literally, to be sidelined. Manufacturing was perceived as dirty, dark and dangerous, incompatible with other uses and outdated.

Urban economies shifted away from the production of physical products and towards intangible sources of wealth generation – knowledge industries, culture and services. In New York, blue-collar work and workers began to be portrayed as relics of a bygone era. As a result, manufacturing jobs plummeted from over one million in the 1950s to less than 200,000 in the 2010s.

Reversing industrial decline

The idea of the productive city might currently be popular, but reversing these longstanding processes of industrial decline is not easy. In recent years, the city of Brussels has made a name for itself as a local production hub. And yet, industrial production and employment is still falling.

In London, the situation is similar. Urban manufacturing is increasingly talked about and small-scale and artisanal production are on the rise. However, the sector’s overall contribution to the city’s gross value added and total employment is still far from recovering from its decline of recent decades.


To counter this trend, the revised London Plan – the city’s spatial development strategy – advocates intensifying and densifying existing industrial sites to create additional capacity, as well as mixing them better. While it lacks a citywide strategy to re-industrialise urban spaces, it does suggest stacking uses: allowing flats, say, to be built above industrial space or making rooftops usable for leisure, commerce and green infrastructure.

The UK’s first open-access factory has just opened in north-east London’s Lea Valley with support from Enfield council. This social enterprise, Bloqs, provides 32,000 square feet of workspace and £1.3 million worth of equipment for a wide range of crafts in a converted warehouse. It is part of a multi-billion pound urban regeneration project bringing 10,000 homes and 6,000 jobs to the area.

As with Winnenden’s new neighbourhood, the hope in Enfield is to showcase how urban manufacturing can help a city thrive. But where JOTT’s intervention will be permanent, Bloqs is classified as “meanwhile use”. There is no guarantee the factory will remain a permanent fixture after its current 12-year lease expires. Research suggests that it should: it is precisely the kind of productive space our cities need.


This article was originally written on The Conversation. Read it here…